Ultrasound is now an integral part of any gynecological assessment. Using ultrasound, most gynecological conditions are diagnosed much easier and with great accuracy during a single outpatient visit. The introduction of three-dimensional (3D) ultrasound has the potential of creating a huge impact on the management of gynecological patients. To make the maximum benefit of this modality, the clinicians need to be trained on how to utilize this technique and should be made aware of all the potential uses and capabilities of the machines’ software, which are built in the relatively new technology of 3D. In this review article, we discuss how to obtain optimum 3D images and some of the possible clinical applications of this technique. We also discuss in more detail the three major steps in obtaining 3D images, which are volume acquisition, volume display, and volume analysis.
Ultrasound represents a non-invasive diagnostic tool that utilizes non-ionizing energy for visualization of internal structure [1]. Three-dimensional (3D) ultrasound is a technique that has been used for decades, which facilitates the conversion of a two-dimensional (2D) image to a volume-based real-time image. The advantage of using 3D ultrasound is represented by the anatomic acquisition of a volume rather than obtaining a slice. The produced volume contains all the needed information, which enables the technician to be far less dependent on the method of initial acquisition, since any view can be reconstructed and analyzed from the stored volume information. The ability to generate an added volume of live scanning and the use of different planes, as well as to see a picture just like magnetic resonance imaging (MRI) and computed tomography (CT) scans, makes 3D ultrasound an essential tool that can be employed in many clinical scenarios and could potentially replace MRI scans.
2D ultrasound remains to be a crucial screening tool in obstetrics and gynecology and is often good enough for most purposes; however, the use of 3D ultrasound has been heavily applied in recent decades as it may add more clinical information and improved care. The acquired volume data can be used to confirm the diagnosis for research or auditing. Obstetricians use 3D ultrasound imaging in visualizing the gestational sac, localizing the site of an ectopic pregnancy, and screening for any fetal anomalies of the face, spine, limbs, and fetal heart [1]. 3D ultrasound in gynecology remains underutilized. In this review article, we discuss the clinical applications of 3D ultrasound in gynecology, which include the evaluation of any uterine structural congenital abnormalities, uterine fibroids, adenomyosis, endometrial polys, intra-uterine device placement and localization, and infertility workup [2].
For acquiring a good volume using 3D ultrasound, it is required to determine a small region of interest, define an acquisition plane, and set an acquisition time and angle. All these parameters vary depending on the specific organ or structure that is being screened. Once the technician has obtained a good volume, an orientation is performed to yield the desired 3D picture, which can be retrieved and reproduced or sent to another remote location for a second opinion evaluation. There are three essential steps to be done to utilize the technique optimally.
Acquisition of Volume
In order to acquire a good volume, some criteria must be fulfilled. The region of interest must be determined. It is essential to determine the height and width of the volume of interest. This area should be as small as possible. The acquisition angle should be between 30-40 degrees and the acquisition time should be set to be between 7.5 and 15 seconds. The background artifact of the image can be reduced by shortening the acquisition time. It is also necessary to determine the acquisition plane depending on the organ of interest, avoiding any structures that might be obstructing the view [3].
Display of Volume
Volume display could be achieved using the following approaches [4].
Multiplanar reconstruction (MPR)
MPR uses the known x, y, and z planes of a given image, which represent the parasagittal, coronal, and transverse sections. This allows the viewer to visualize the produced image in three orthogonal planes, which correspond to the three planes that are at right angles to each other. This viewing modality helps in providing detailed information in one single display. Figure 1 displays an image in the MPR option.
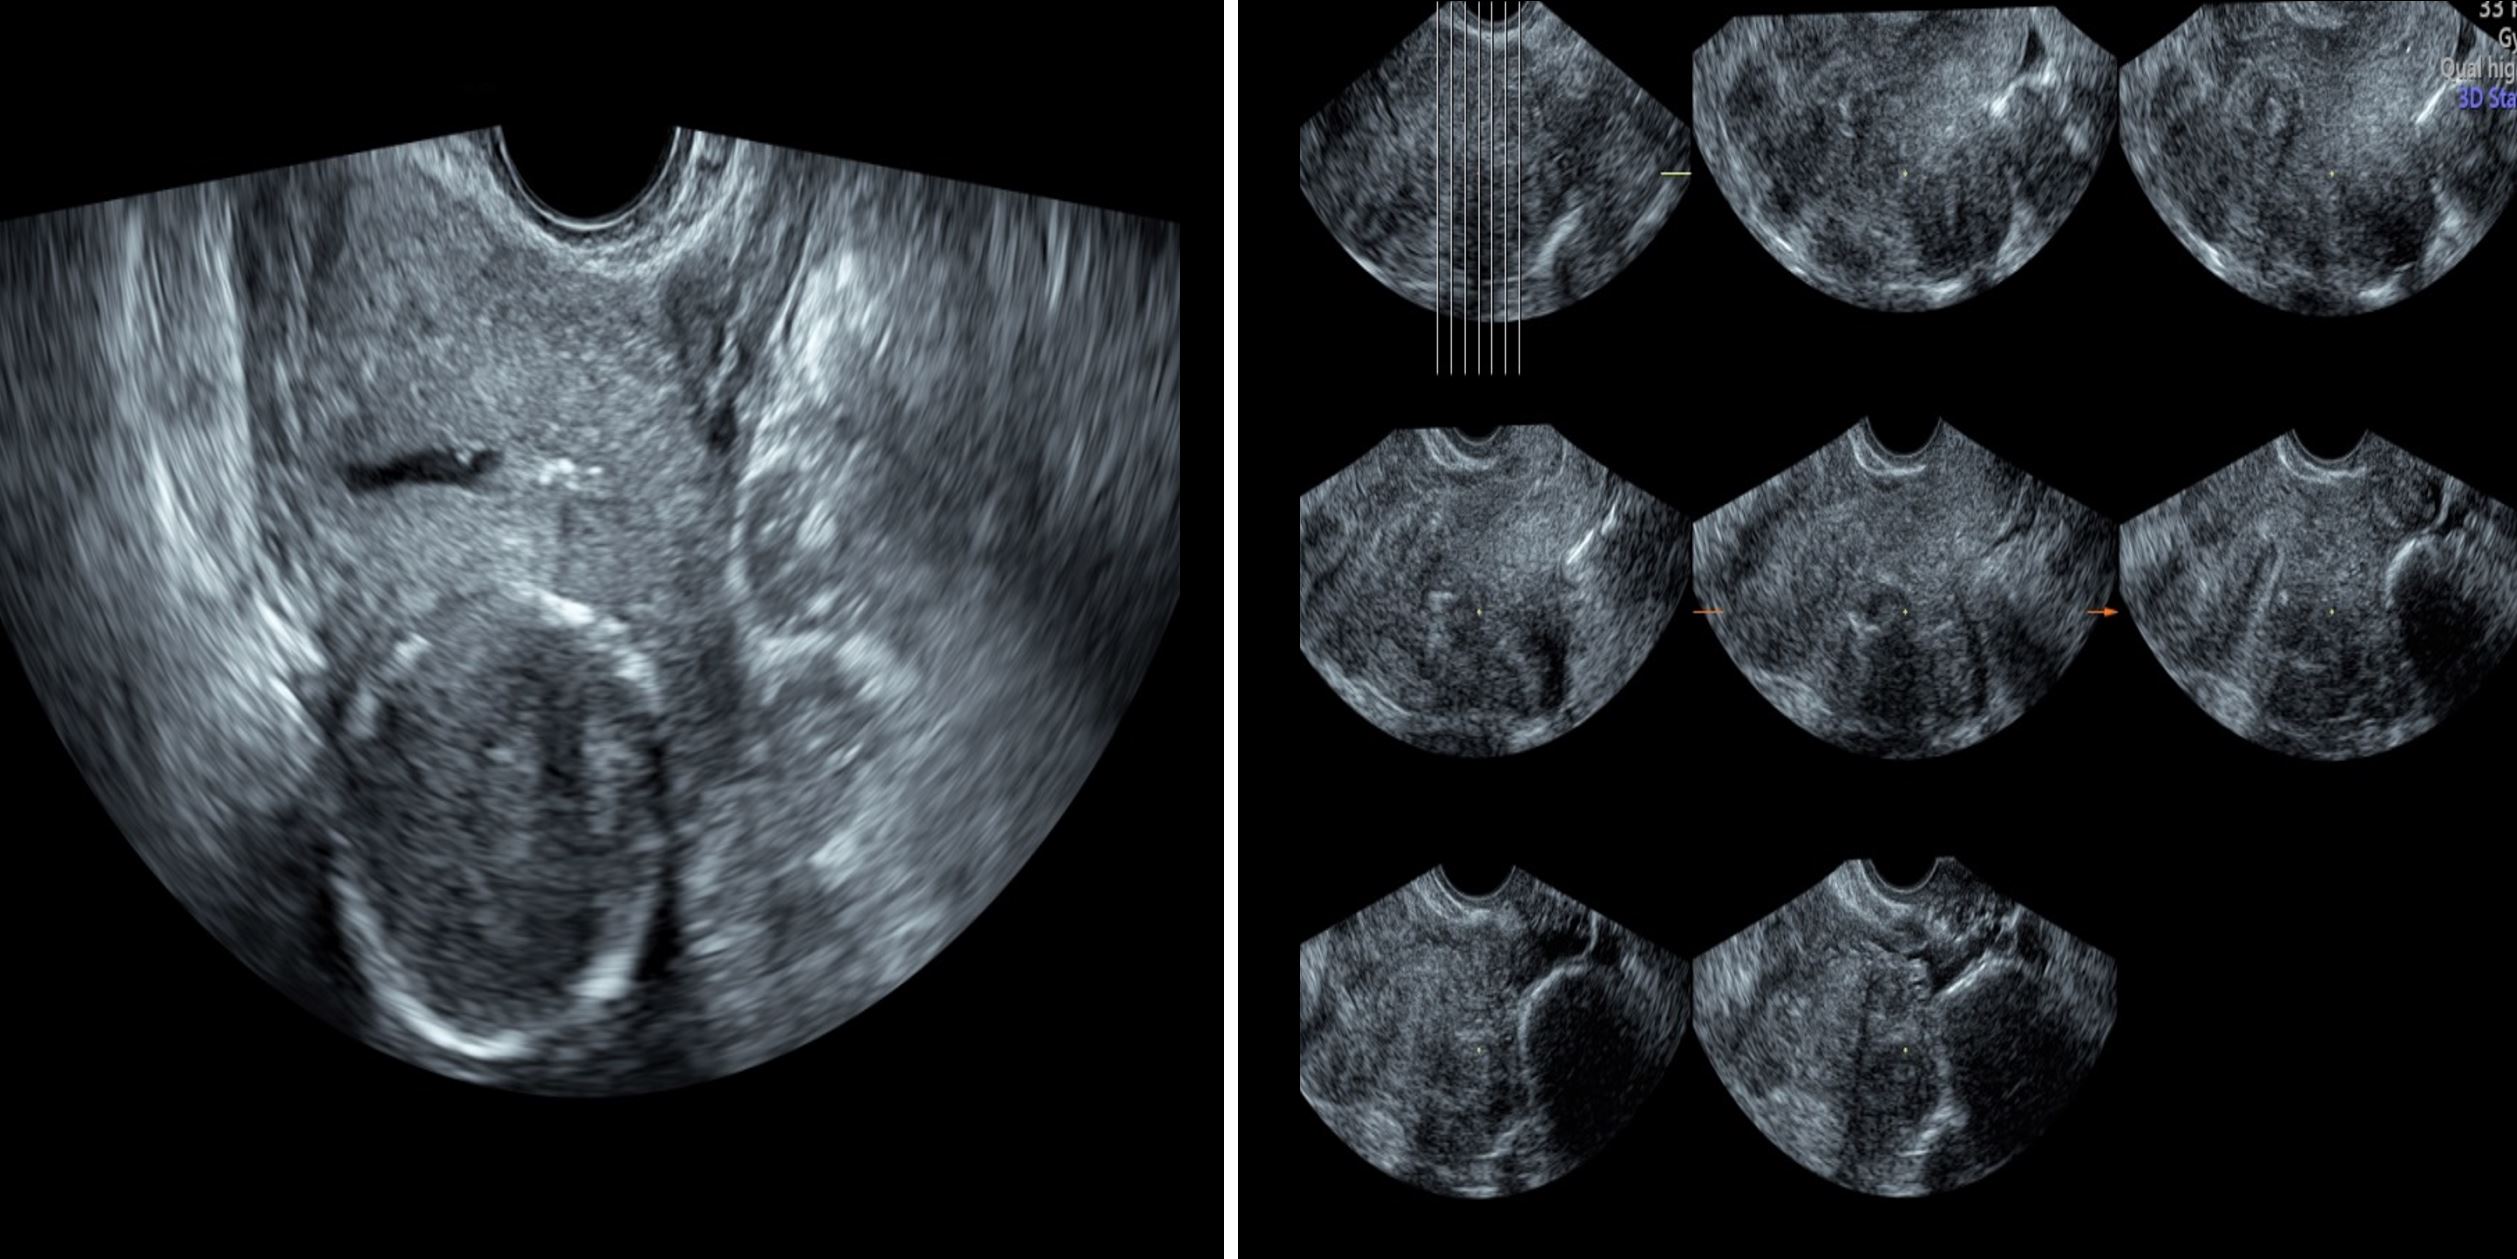
Tomographic Ultrasound Imaging (TUI) or Multi-View
This visualization consists of tomographic sections through a given MPR image. This allows the clinician to obtain further anatomical details through specific sections of the image and correlate those with the clinical information (Figure 2). This tool is specifically useful in visualizing the adnexa and differentiating between simple cysts and paraovarian cysts. Additionally, it has a major role in visualizing the adnexal masses; an example of this is the case of hydrosalpinx.
Surface Rendering Images (SRI)
This option allows visualization of the image with a 3D effect. This shows increased visual impressions of the pelvic structures. Additionally, this option is often used to demonstrate the external features of specifically separated pelvic structures and adds some depth to the displayed image. However, this technique is employed more in obstetrics than gynecology. Figure 3 displays an image in the SRI option.
Analysis of Volume
Once the clinician obtains the needed images through the various modes and display options, the resultant volume contains all the needed information that can later be used for analysis and correlation with the clinical picture.

Figure 1. Multiplanar reconstruction image showing endometrial poly.
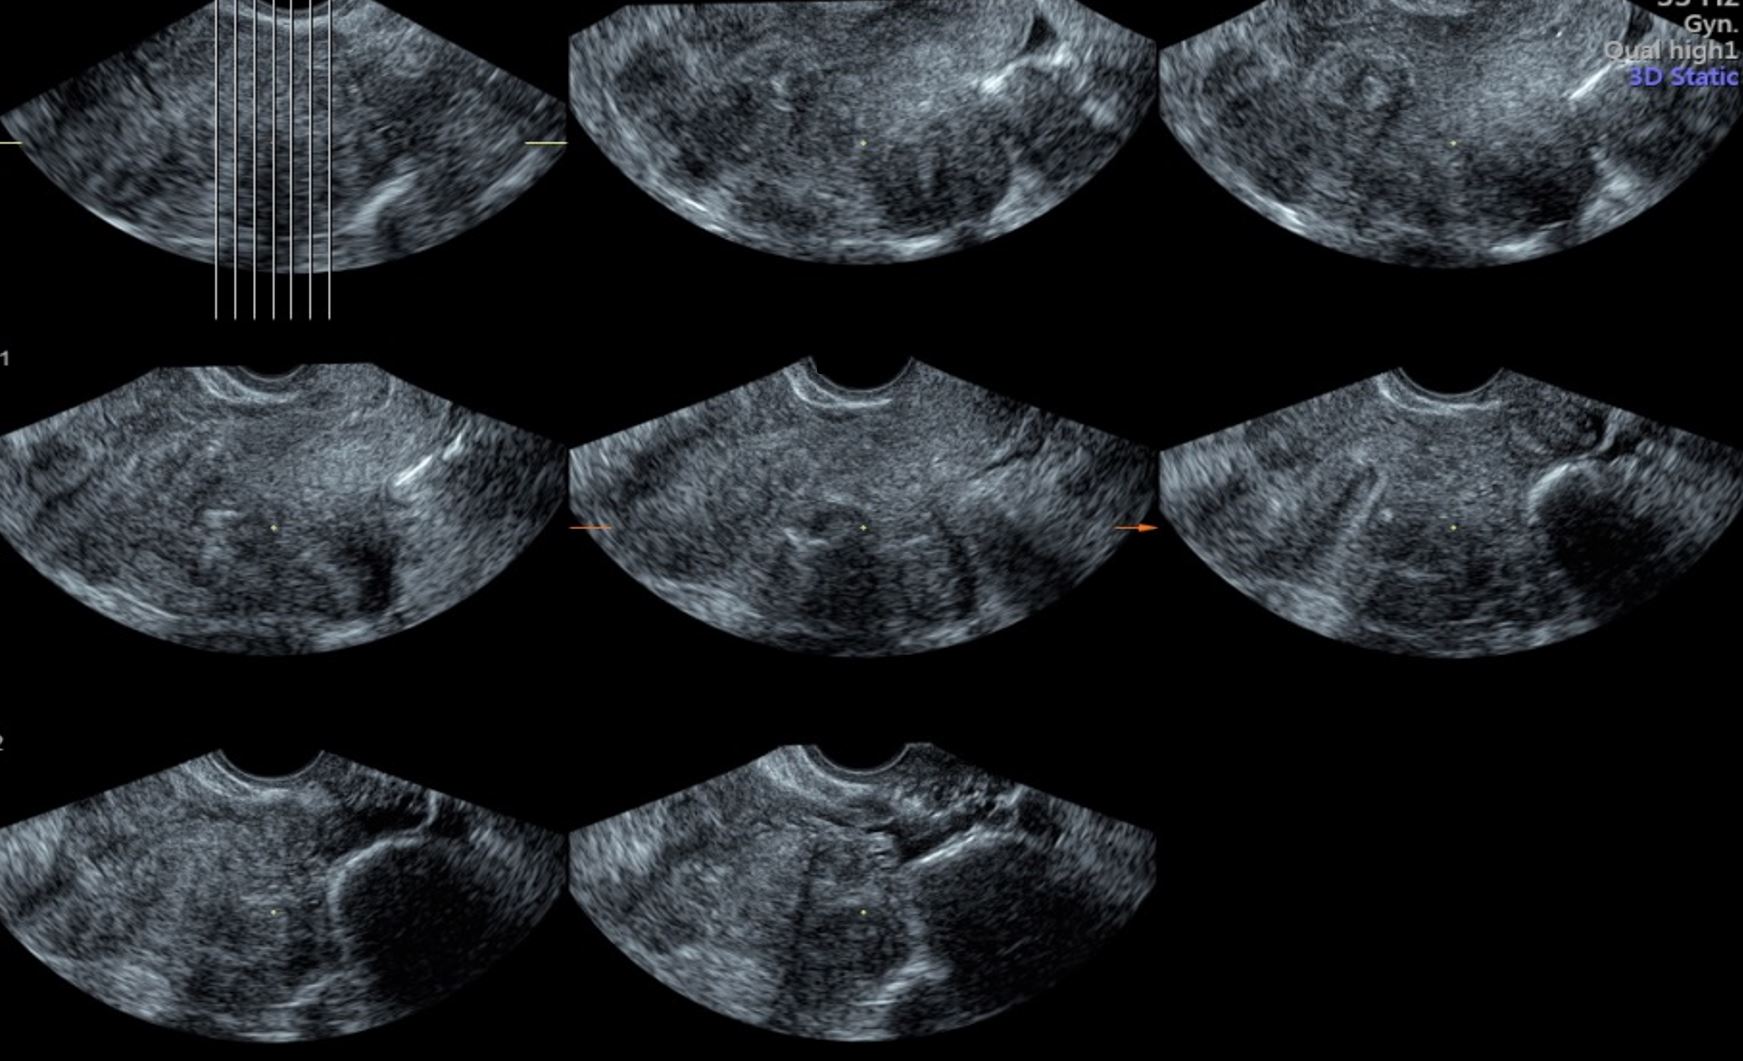
Figure 2. Tomographic ultrasound imaging or multi-view showing different cross sections through the uterine cavity.
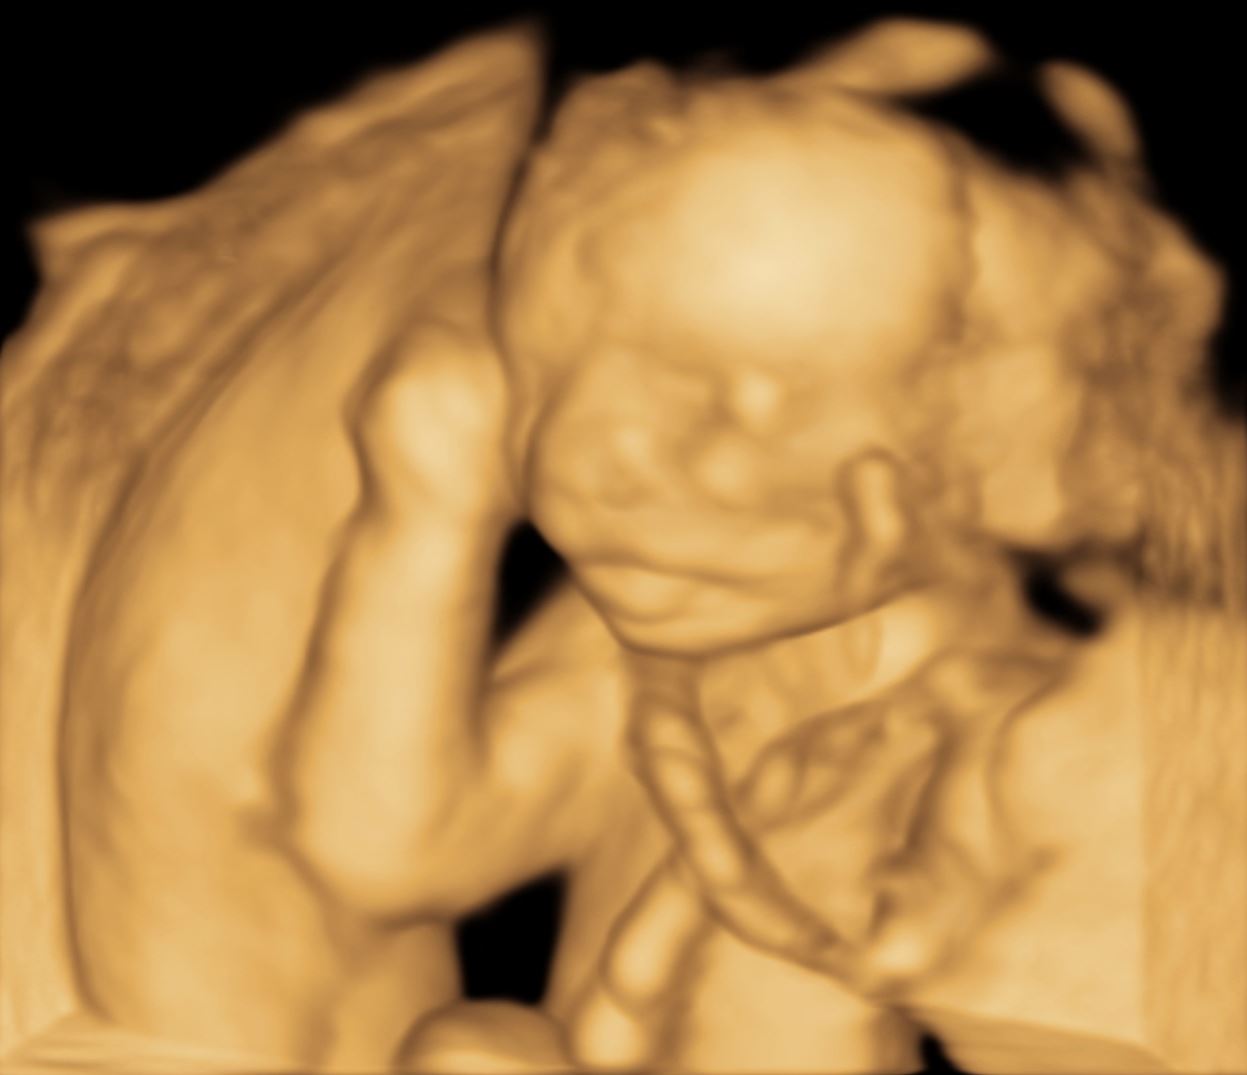
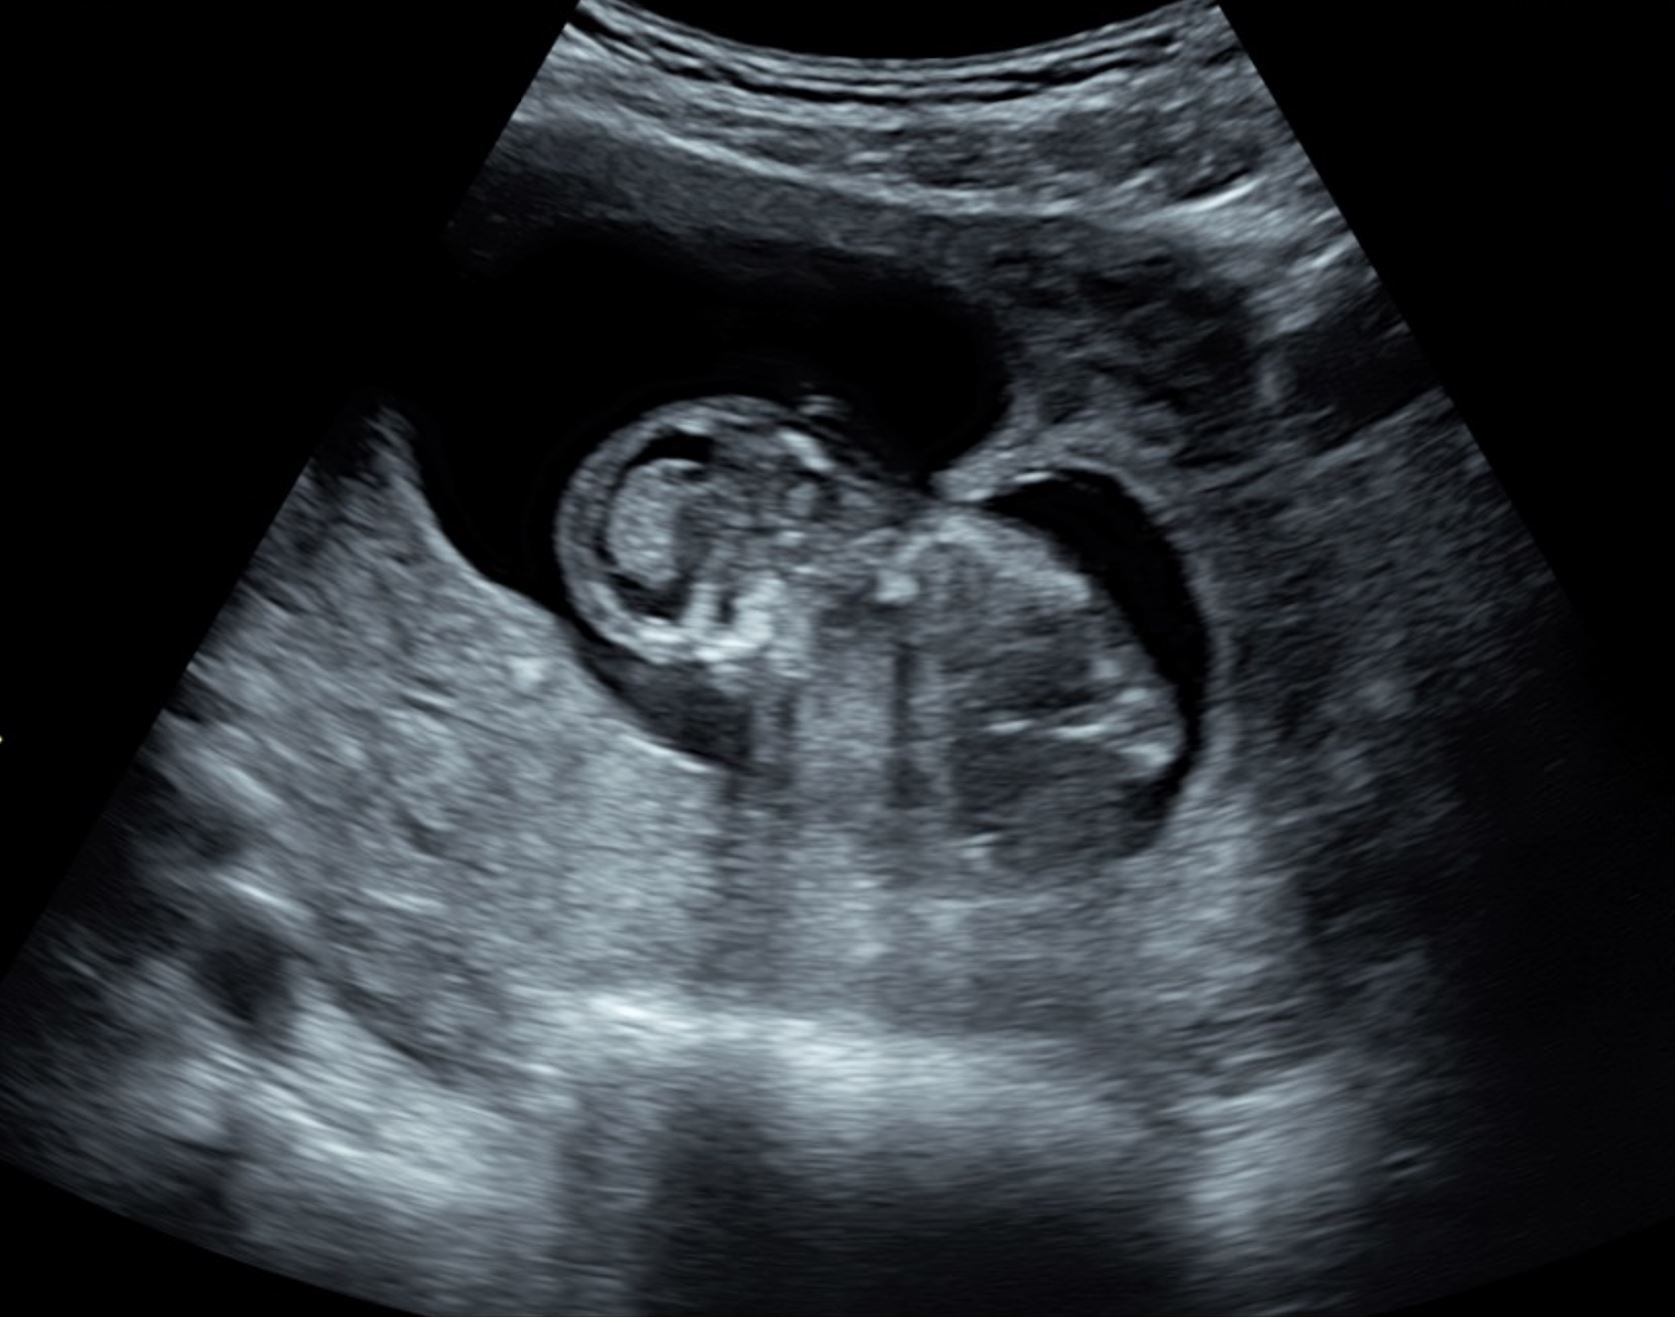
Figure 3. Surface rendering images used to visualize a 19 weeks and 6 days fetal profile.
Detecting Anatomical Abnormalities
Müllerian Duct Anomalies
Congenital uterine malformations are not uncommon, as the commonly quoted incidence is 4.3% in the general fertile female population [5]. There are three developmental phases of the paramesonephric ducts: organogenesis, fusion, and the septum resorption phase. Malformations can occur due to the failure of any of these phases, leading to congenital anomalies of the reproductive tract. The majority of women with müllerian duct anomalies do not have issues conceiving; however, previous studies have reported that they have a higher rate of obstetric and non-obstetric complications including amenorrhea, dysmenorrhea, spontaneous abortion, premature deliveries, abnormal fetal positions, and complications during delivery such as dystocia [6-8].
A septate uterus is the most common müllerian duct anomaly as it accounts for more than 55% of such abnormalities and results from failure in the septum resorption phase, which is the essential step to form one whole endometrial cavity [9]. Specifically, women with a subseptate uterus have a higher incidence of recurrent miscarriage. A bicornuate uterus accounts for approximately 10% of the müllerian duct anomalies and results in the failure of the fusion phase in which the uterovaginal horns join at the fundus level to form the upper vagina, cervix, and uterus [10]. In many instances, the uterine anomaly is seen for the first time during pregnancy (Figure 4).
Given the potential risks, the correct diagnosis of such anatomical abnormalities is crucial, and this could be easily achieved through 3D ultrasound. The use of 3D ultrasound has been reported to have a sensitivity of 93% and a specificity of 100% in diagnosing uterine abnormalities [11]. The main advantage of 3D ultrasound is that it provides frontal views of the uterus, which are essential in confirming the diagnosis, and would be otherwise impossible to achieve using the traditional 2D ultrasound [8]. This technology has helped in further classifying the different types of uterine abnormalities, given the additional details that have been reported after its utilization [12]. The best mode to be used in visualizing a septate uterus is rendering and the best time to do so is when the endometrium is at its maximum thickness. Figures 4 and 5 illustrate the use of 2D and 3D ultrasound in diagnosing some of the Mullerian duct abnormalities.
Leiomyoma and Adenomyosis
Leiomyomas and Adenomyosis are common in women of reproductive age and have similar presentations. The use of 3D ultrasound is again a useful tool in differentiating and diagnosing both cases. A recent study was performed in women who had presented with abnormal uterine bleeding, dysmenorrhea, abdominal masses, or dyspareunia, or who had been diagnosed with either disorder [13]. Both transvaginal and transabdominal ultrasound were performed in addition to Doppler sonography, and those patients who were subsequently selected for operative treatment were included in the study. The radiological diagnosis was then correlated with the intraoperative and histopathological diagnosis to reveal the specificity and sensitivity of 3D ultrasound in diagnosing both conditions. 3D ultrasound was 93.4% sensitive and 95.6% specific in diagnosing leiomyoma, and 95.6% sensitive and 93.4% specific in diagnosing adenomyosis. Based on these results, the use of 3D ultrasound in diagnosing and differentiating between the clinically similar conditions is highly valuable, especially when paired with Doppler studies. Figure 6 illustrates the use of 3D ultrasound in diagnosing leiomyomas.
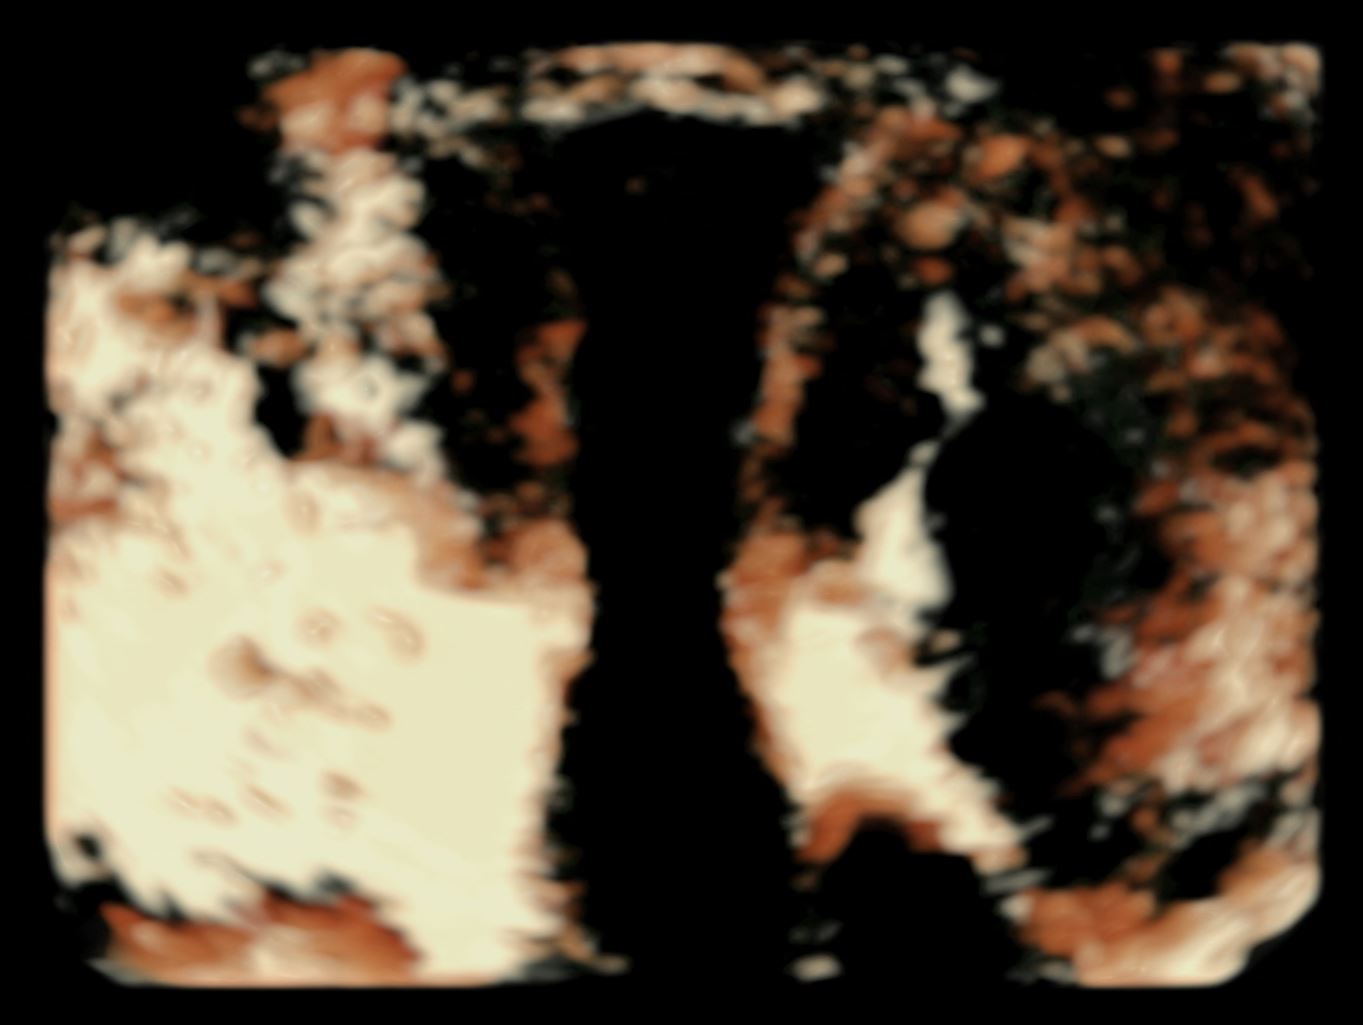
2D ultrasound has a limited use in diagnosing adenomyosis, as it shows nonspecific signs such as the presence of focal or diffuse myometrial heterogeneity [14]. Using a 3D transvaginal probe, coupled with the “inverse” mode and Doppler studies, is an optimal way of diagnosing adenomyosis, which is seen as the irregular border of the endometrium with a fuzzy appearance of the cavity on 3D ultrasound. Other sonographic characters of adenomyosis include (1) uterine length increase >12 cm that suggests globular uterine enlargement, (2) presence of cystic anechoic spaces in the myometrium, (3) subendometrial echogenic striations, (4) vague endometrial-myometrial borders, and (5) increased uterine and transition zone thickness [15]. Figure 7 illustrates the use of 3D ultrasound in diagnosing adenomyosis.

Figure 4. 3D pictures of Bicornuate uterus. Both uterine horns can be clearly visualized using 3D static and rendering modes. 3D, three-dimensional.

Figure 5. Two-dimensional image of septate uterus (12 weeks and 6 days pregnant).
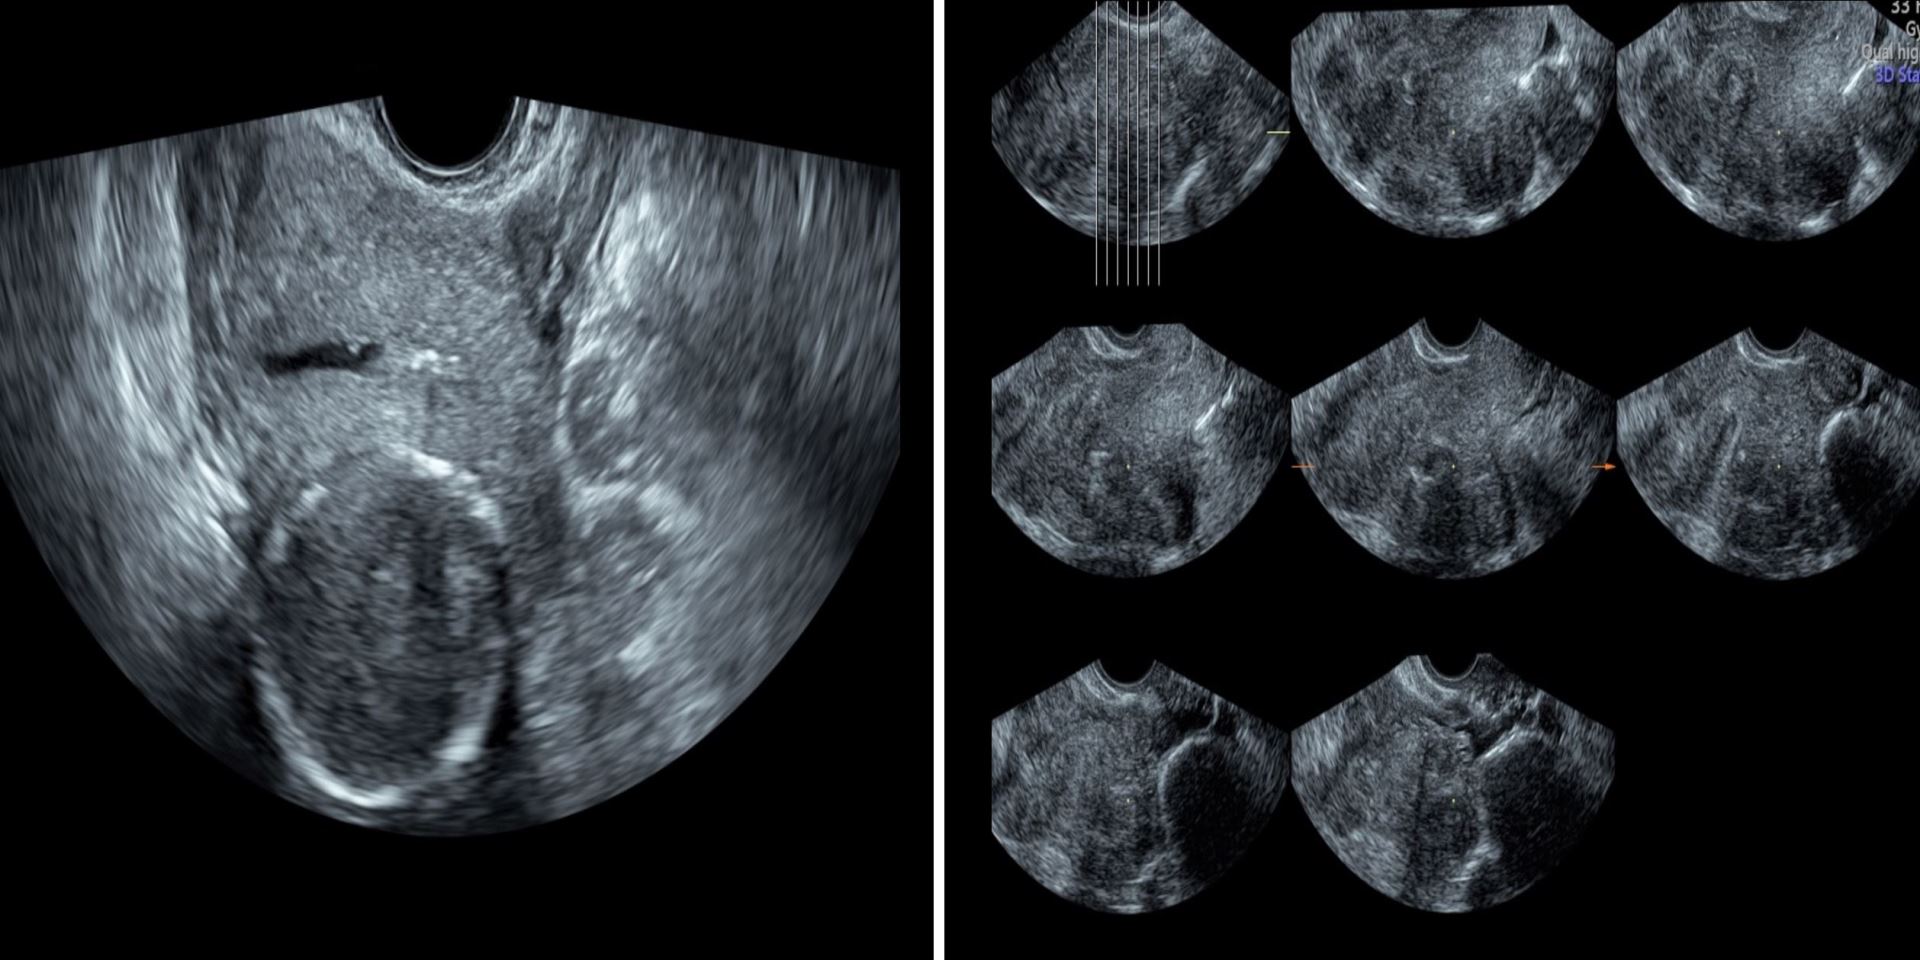
Figure 6. Leiomyomas in two-dimensional and tomographic ultrasound imaging displays. Those appear as well defined, solid masses with an echogenicity similar to that of the myometrium.

Figure 7. Utilizing inverse mode for the diagnosis of adenomyosis. Border irregularities of the endometrium and the “fuzzy” appearance can be appreciated in the figure.
Intrauterine Device (IUD) Placement and Localization
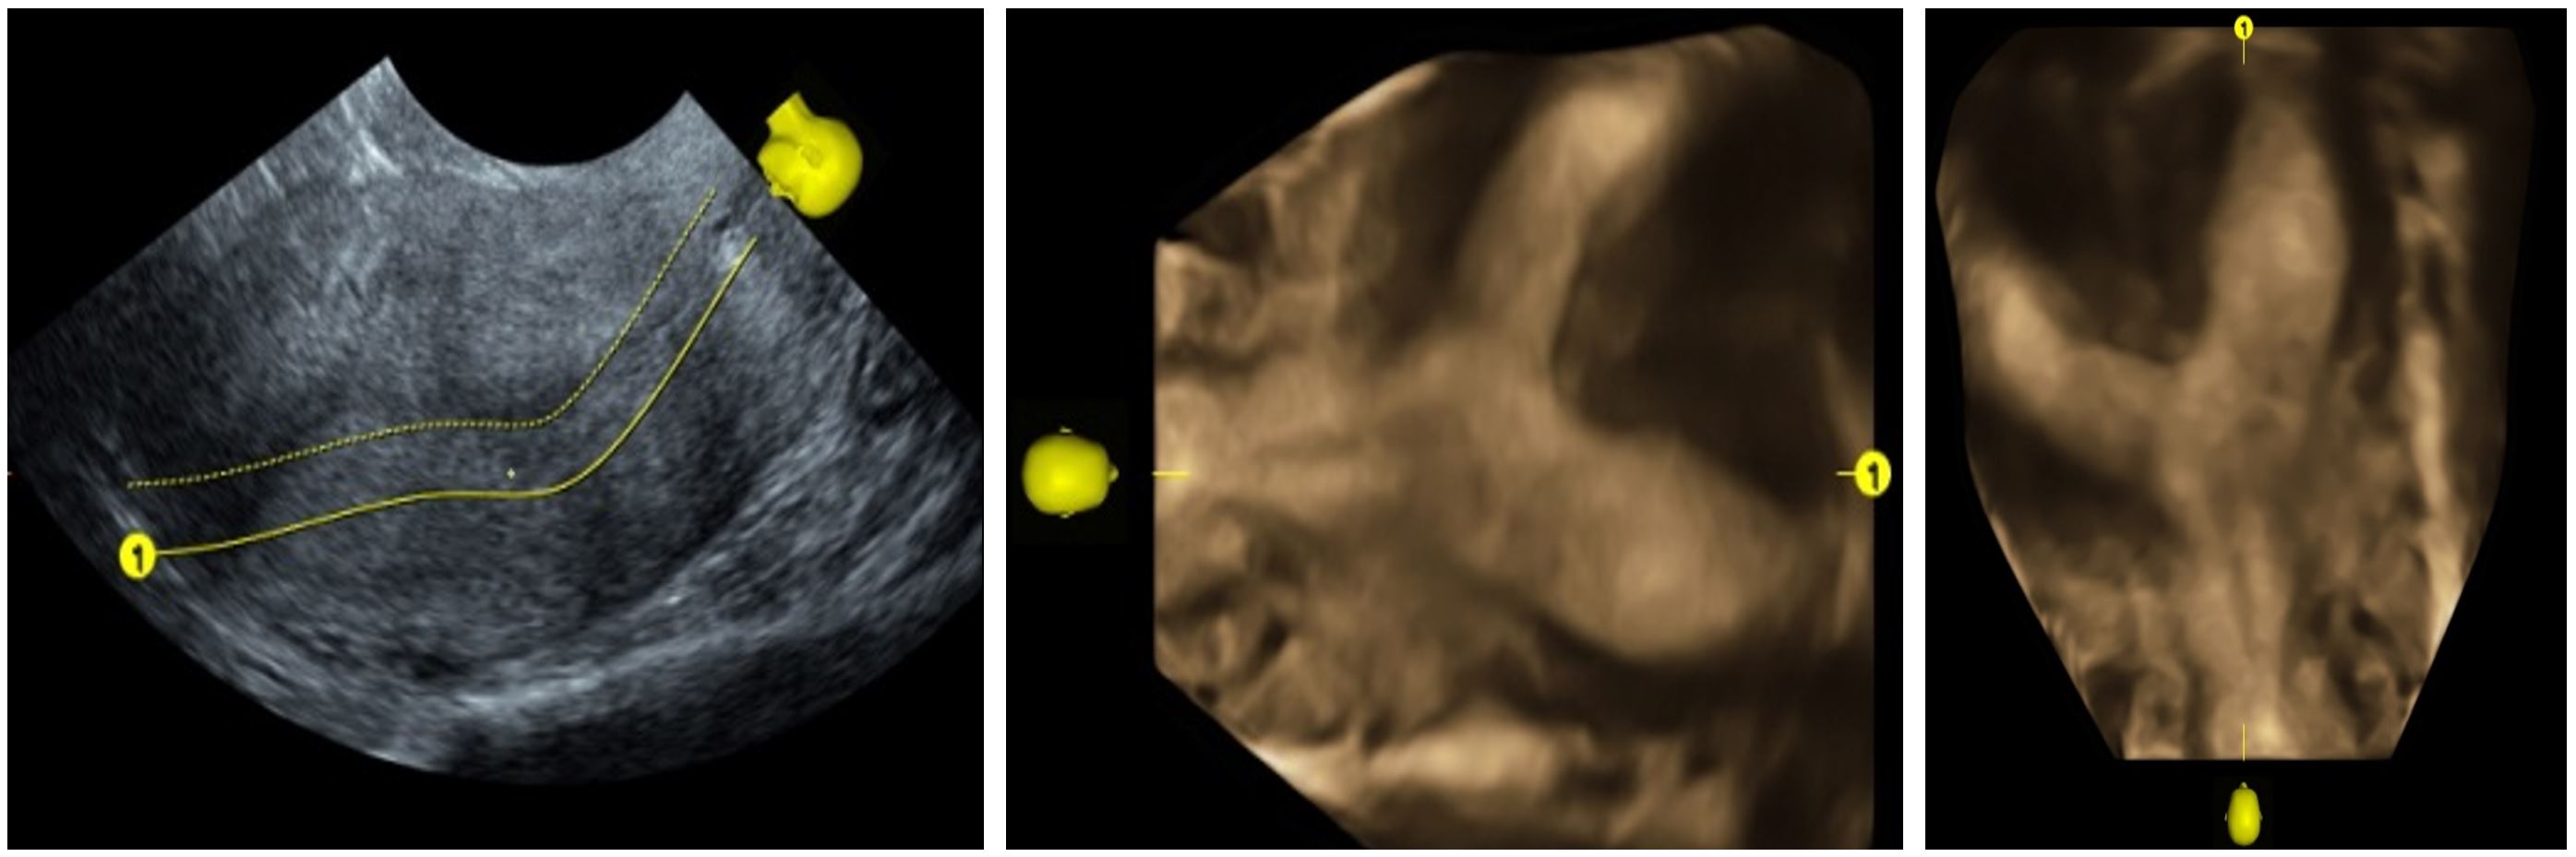
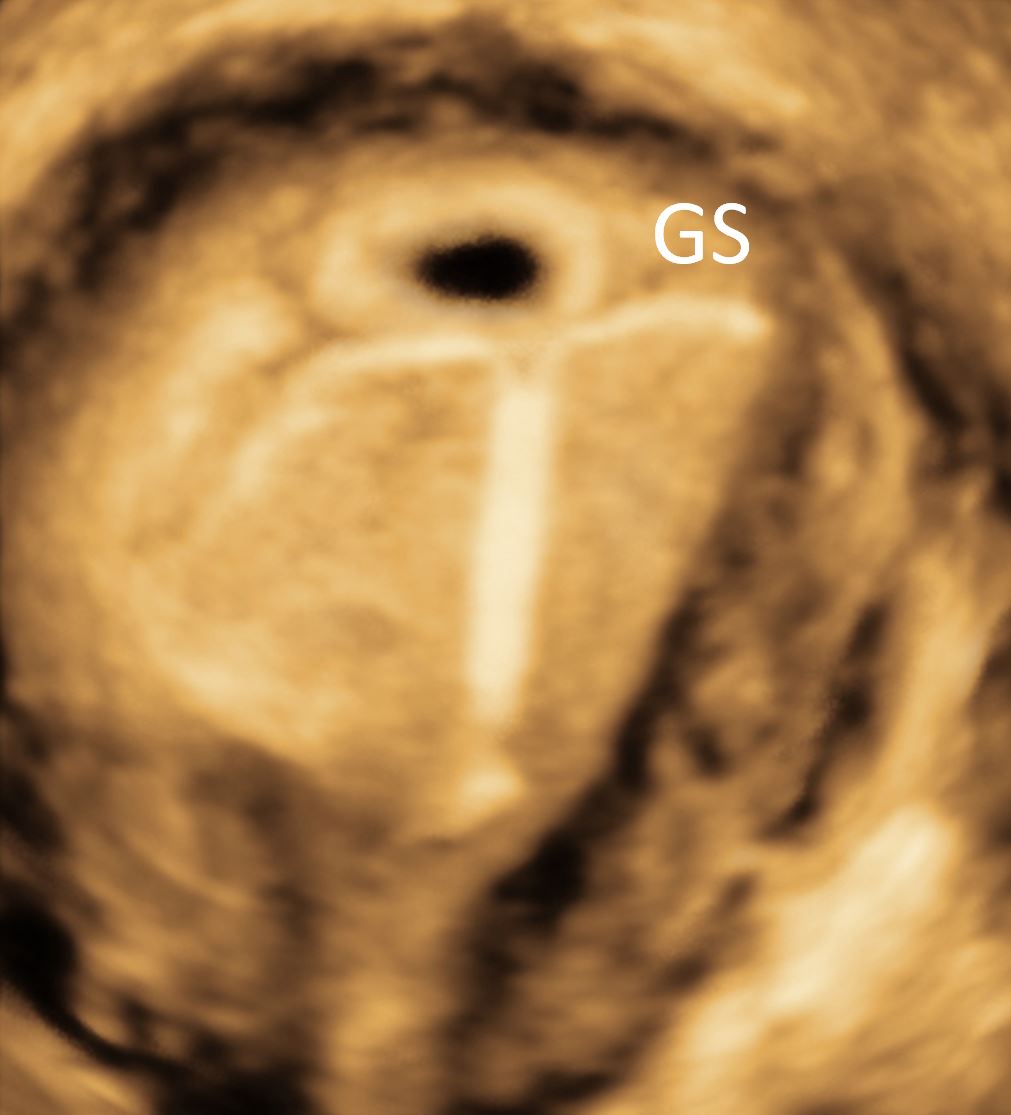
The use of IUDs has been on the rise not only for family planning purposes but also for the treatment of menorrhagia [16]. These devices do cause various side effects, such as dysmenorrhea and abnormal bleeding. Incorrectly placed and embedded IUDs are thought to be a direct cause of such side effects and grant further evaluation. IUDs can be visualized using the conventional 2D ultrasound by using the location of the shaft and the arms. However, the use of 3D ultrasound is often superior in yielding a definitive localization of the IUD’s arms [17]. A study utilized this technique in investigating the uterine cavity size in patients with and without embedded IUDs to determine whether the women with embedded IUDs have narrower fundal endometrial diameters compared to the women with normally placed IUDs [18]. The study concluded that the women with smaller endometrial cavities did have higher rates of embedded IUD using the 3D rendering of the uterus, which suggested that producing different IUD sizes should be taken into considerations [19]. Figure 8 illustrates the use of 3D ultrasound in localizing a coil in a uterine cavity. In the rare event of pregnancy on top of IUD, the 3D ultrasound can locate the gestational sac in relation to IUD and that may help in subsequent management. The decision to remove the IUD during pregnancy or to leave may become much easier (Figure 9).

Figure 8. Intrauterine devices: multiplanar reconstruction and rendering images used to define the location of coils. The arms can be visualized clearly, which is more difficult to obtain using conventional two-dimensional ultrasound.

Figure 9. The relationship between the intrauterine device and GS is clearly demonstrated. GS, gestational sac.
Infertility Workup: Hysterosalpingo-Contrast-Sonography (HyCoSy)
Female infertility has been on the rise in recent decades and a great percentage of cases are due to obstructions in the fallopian tubes. The obstruction could be due to many causes including congenital factors, tumors, cysts, and salpingitis [20]. Currently, X-ray hysterosalpingography is widely applied in clinics to diagnose oviduct obstruction in infertile women [21]. However, the disadvantages of this method include contrast sensitivity, pulmonary artery embolism, and lipidol stimulation, which can lead to further obstruction due to granulation [22].
Sonosalpingography can be implemented as a non-invasive diagnostic procedure of fallopian tubes patency. It is a relatively simple office procedure with minimal discomfort and side effects, which involves the injection of physiological saline into the uterine cavity by a small catheter. Using this technique, we can visualize the fallopian tubes and examine the uterine cavity in great details.
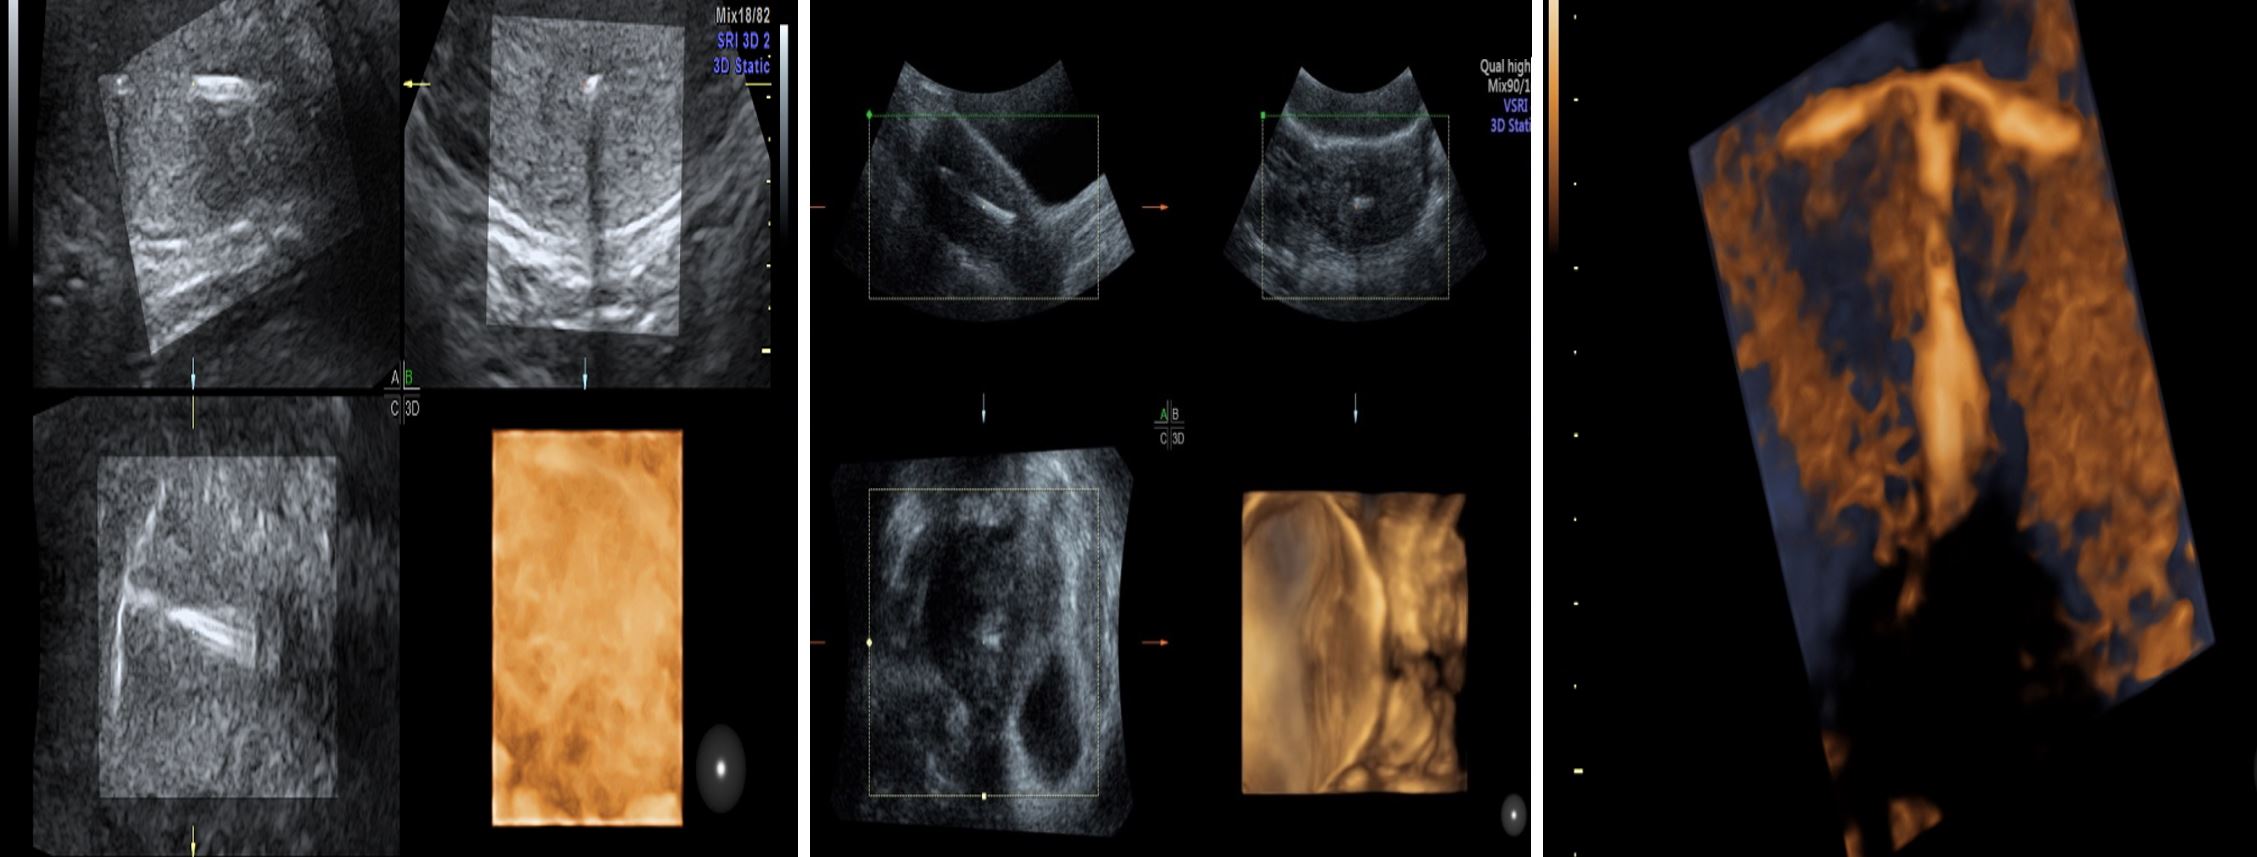
3D-HyCoSy ultrasound has been reported as a gold standard work-up tool in infertile females, which is seen as noninvasive, repeatable, and accurate with a sensitivity of 92% and a specificity of 91% [23,24]. This technology assists in visualizing the morphology of the fallopian tubes and is a safe and accurate test for diagnosing tubal patency and is able to reveal any obstructions in such patients [22]. Figure 10 illustrates the use of 3D ultrasound in performing HyCoSy and testing fallopian tubes patency. 3D ultrasound can play a key role in follicular monitoring during ovarian stimulation cycle. When used in follicular monitoring, 2D can be tedious and time-consuming.
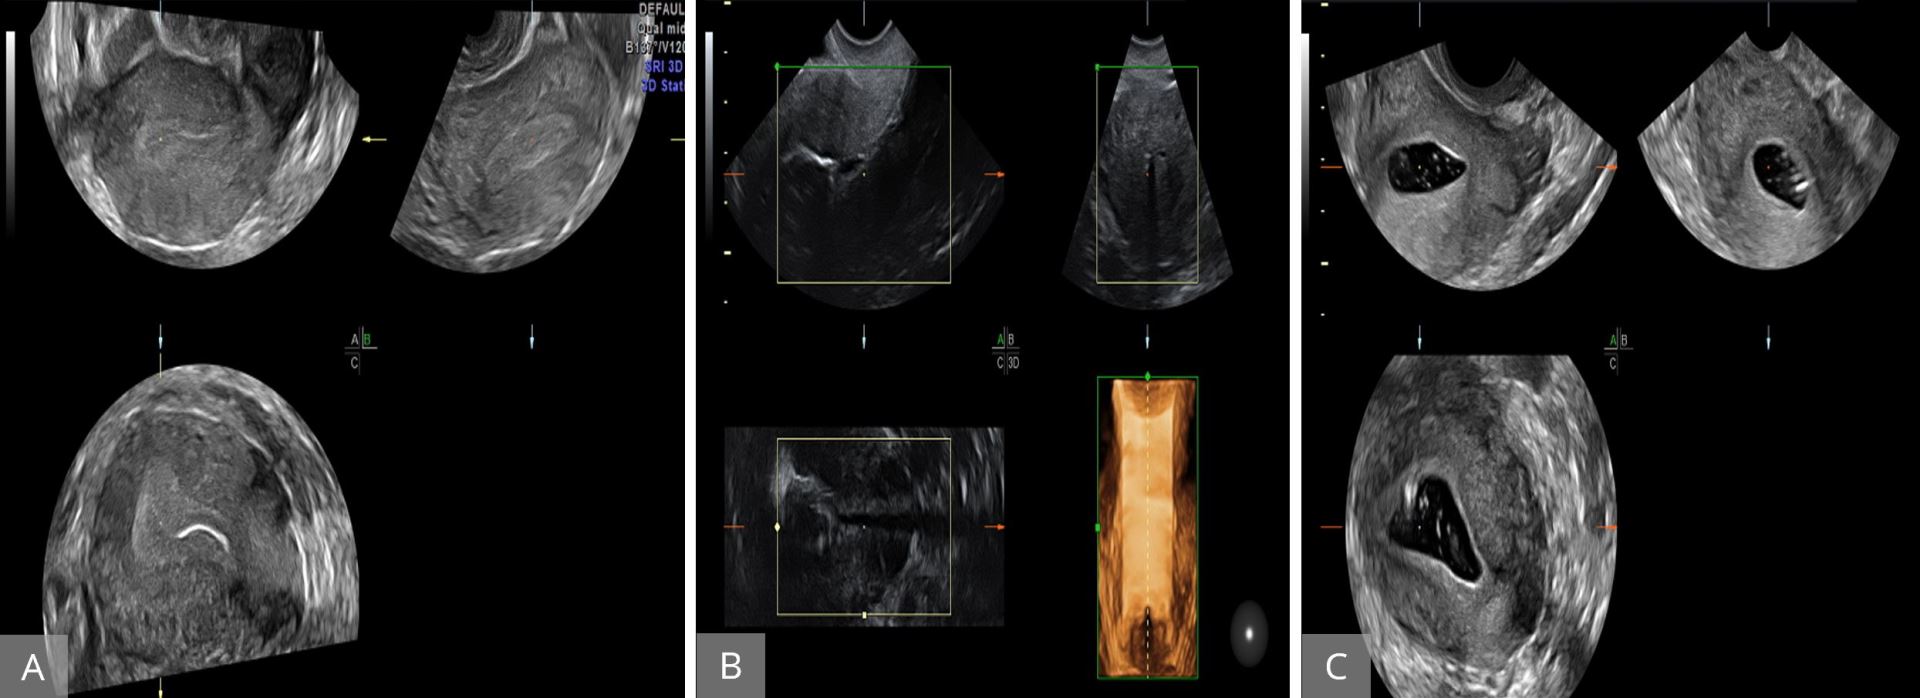
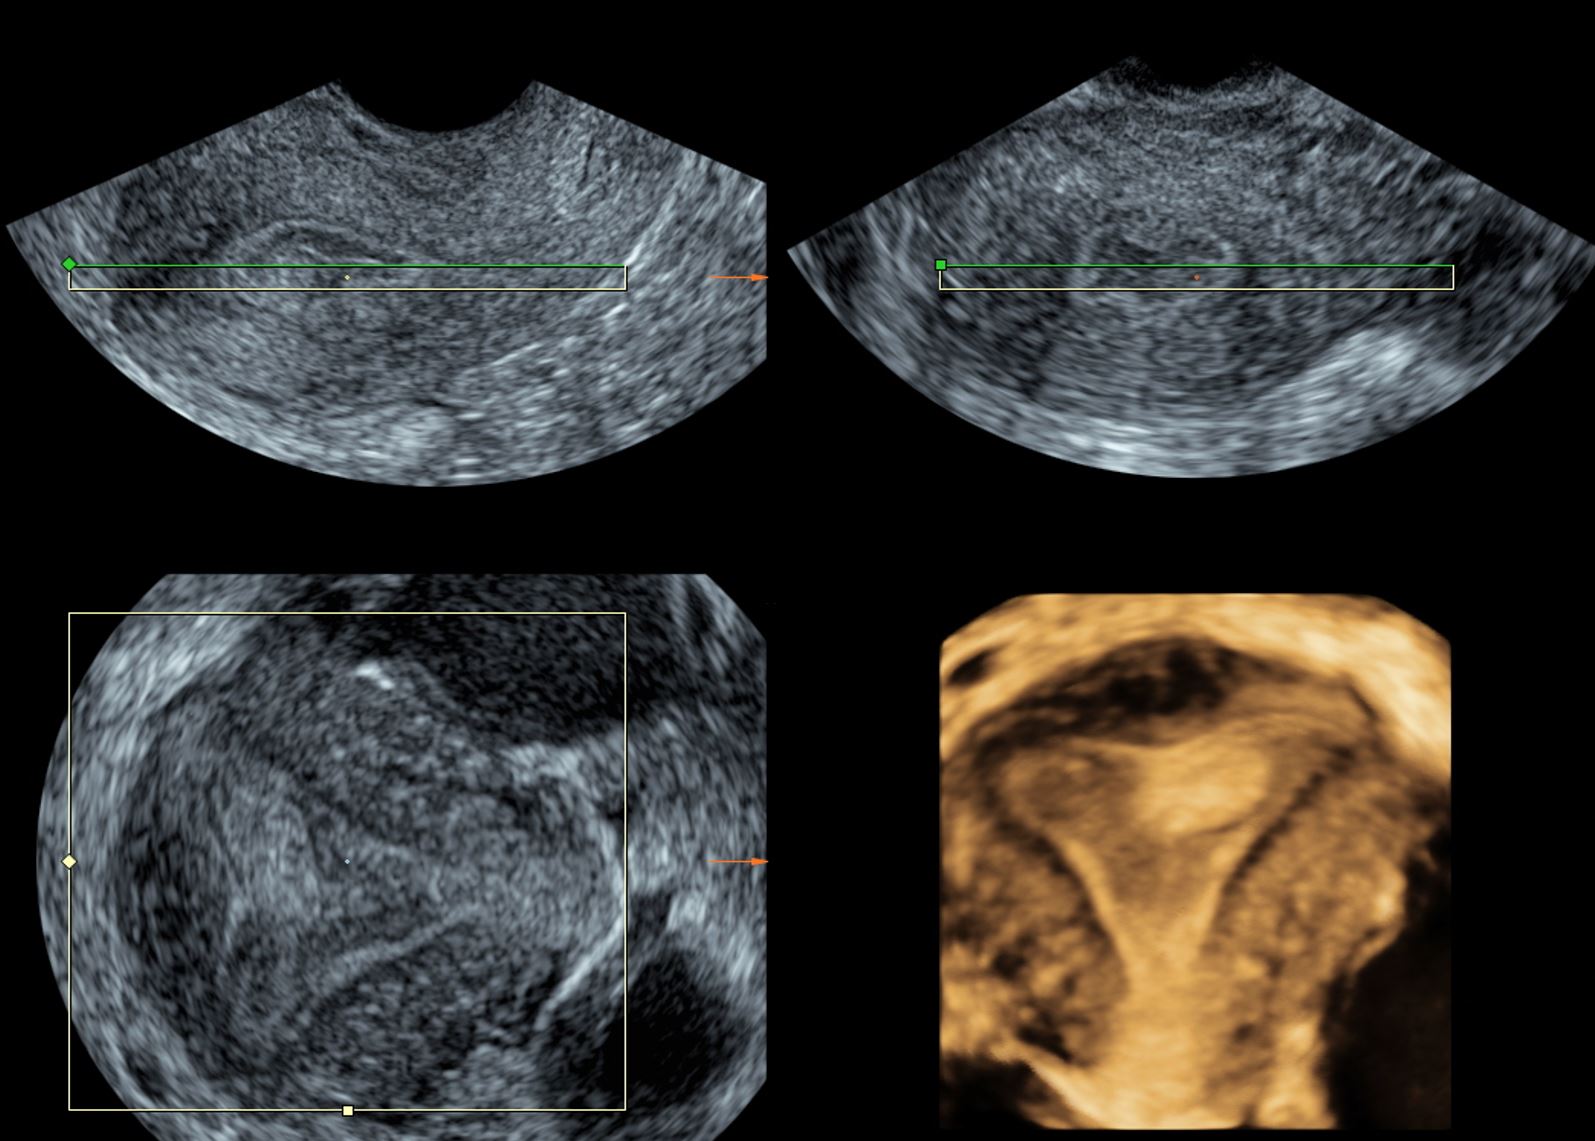
Figure 10. Hystero‐contrast‐salpingosonography with live multiplanar reconstruction mode to visualize the patency of the uterine cavity and tubes. (A and B) Uterine cavity with the Cather inside the cavity before introducing contrasting fluid. (C) After the introduction of fluid.
Ovarian Monitoring in Stimulated Ovarian Cycles
2D ultrasound has been used for years to assess the uterine and ovarian anatomy. Monitoring of ovarian follicular size during stimulation cycles can be tedious and time-consuming. The use of 3D ultrasound allows us to capture the entire ovary and follicles in a single sweep, which may take seconds to complete. This may decrease the time required for scanning. Most of the ultrasound machines are now equipped with the new tool, namely sonography-based automated volume count (SonoAVC). This new modality is extremely precise in monitoring follicular volume. It allows us to automatically calculate the follicular volume (Figure 11). This semi-automated approach helps to reduce examination time, increases consistency among users, and enhances patient comfort during the examination.
The use of ultrasound, particularly the 3D and volume ultrasound, in assisted conception has been studied extensively. This is particularly true in case of down regulations and has been studied extensively [25,26]. The details of the role of 3D in assisted reproductive treatment (ART) are beyond the scope of this review article.
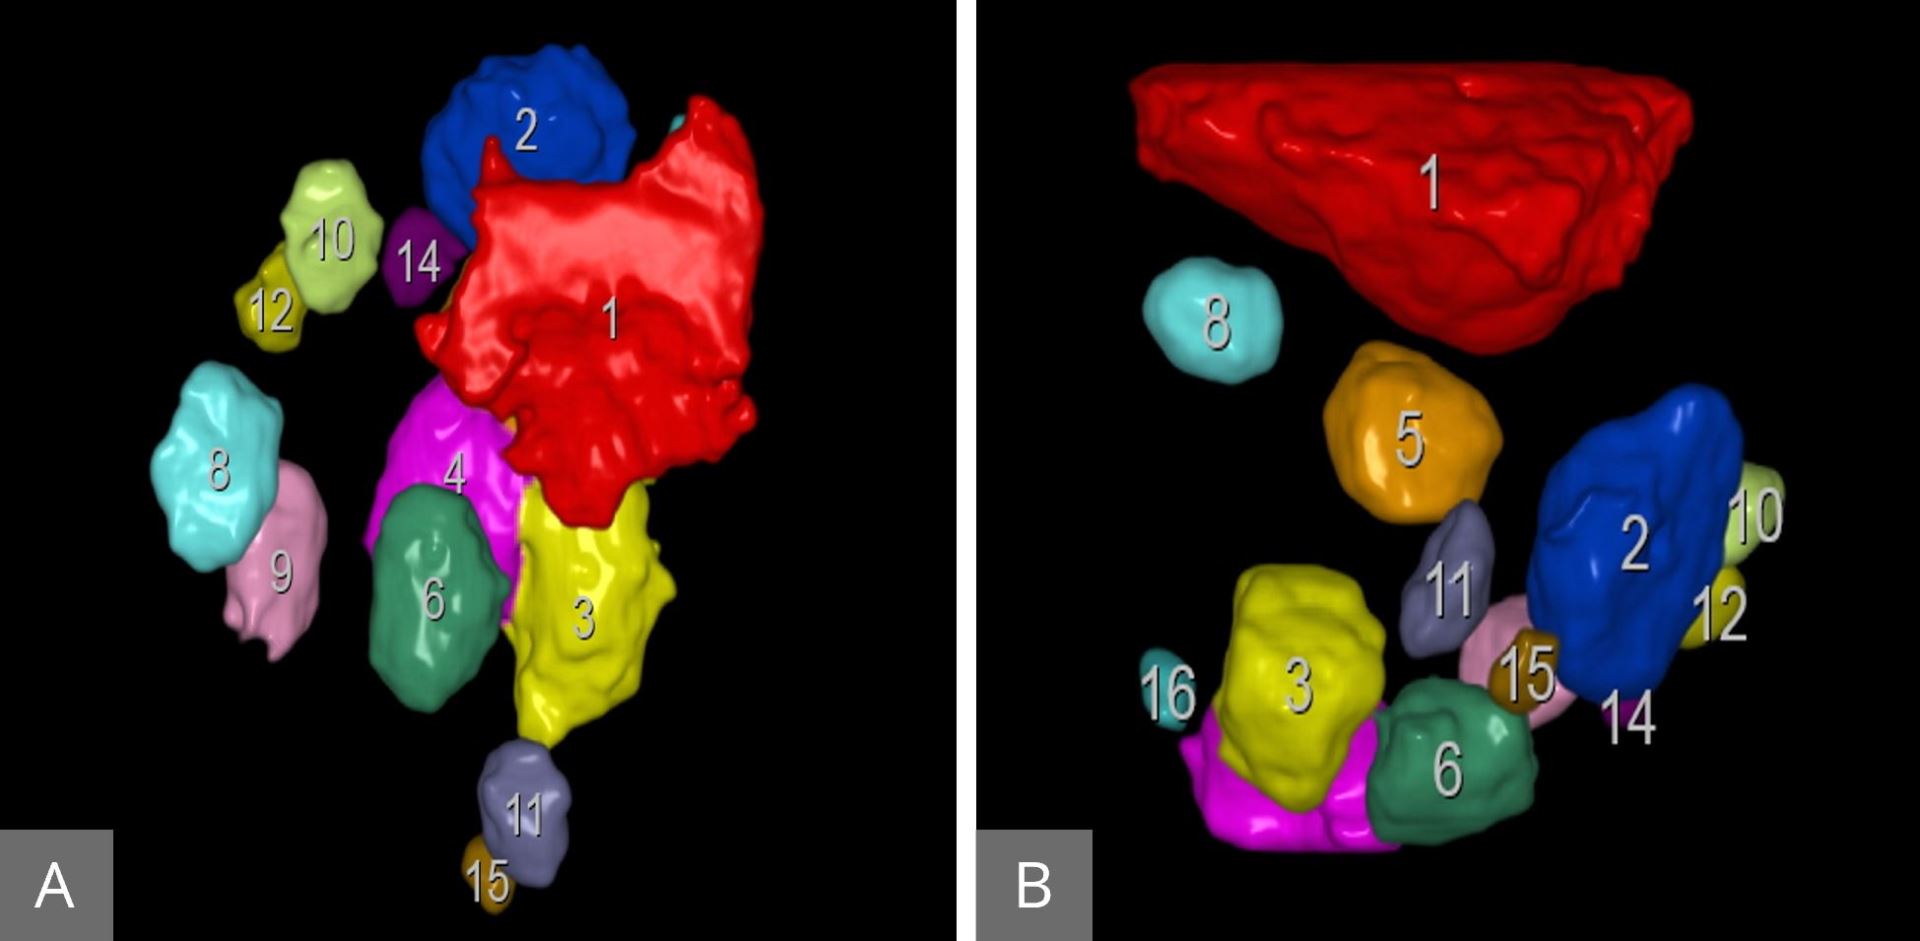
Figure 11. SonoAVC follicles: showing the number of the follicles and the volume of each individual follicle in the right (A) and the left (B) ovaries. SonoAVC, sonography-based automated volume count.
Assessment of Ovarian Reserve
When the ovary is stimulated, it responds by increasing the number of follicles. These follicles produce estrogen, which can be easily measured in maternal serum. The number of these follicles and the amount of estrogen produced collectively is referred to as an ovarian reserve. Knowledge about the ovarian reserve is critical if we want to avoid the potentially serious complication of hyper stimulation. The ability to predict those women who are likely to develop hyper stimulation is very critical to avoid such serious complication. The role of 3D ultrasound in the prediction of ovarian stimulation includes measurement of ovarian volume, antral follicles count, and ovarian blood flow. Measurement of ovarian volume using 3D did not add any extra information compared to the conventional ultrasound [27,28]. The antral follicles measurement as an indication of ovarian response was studied extensively [29,30]. All these studies concluded that the 3D ultrasound did not add any advantage over conventional 2D ultrasound in antral follicles measurement. 3D power Doppler to measure ovarian vasculature as a predictor of ovarian hyper stimulation is showing some promise regarding its effectiveness in prediction of hyper responders [31-33]. The details of the role of 3D ultrasound in ART are beyond the scope of this review article.
Management of Endometrial Hyperplasia and Endometrial Malignancy
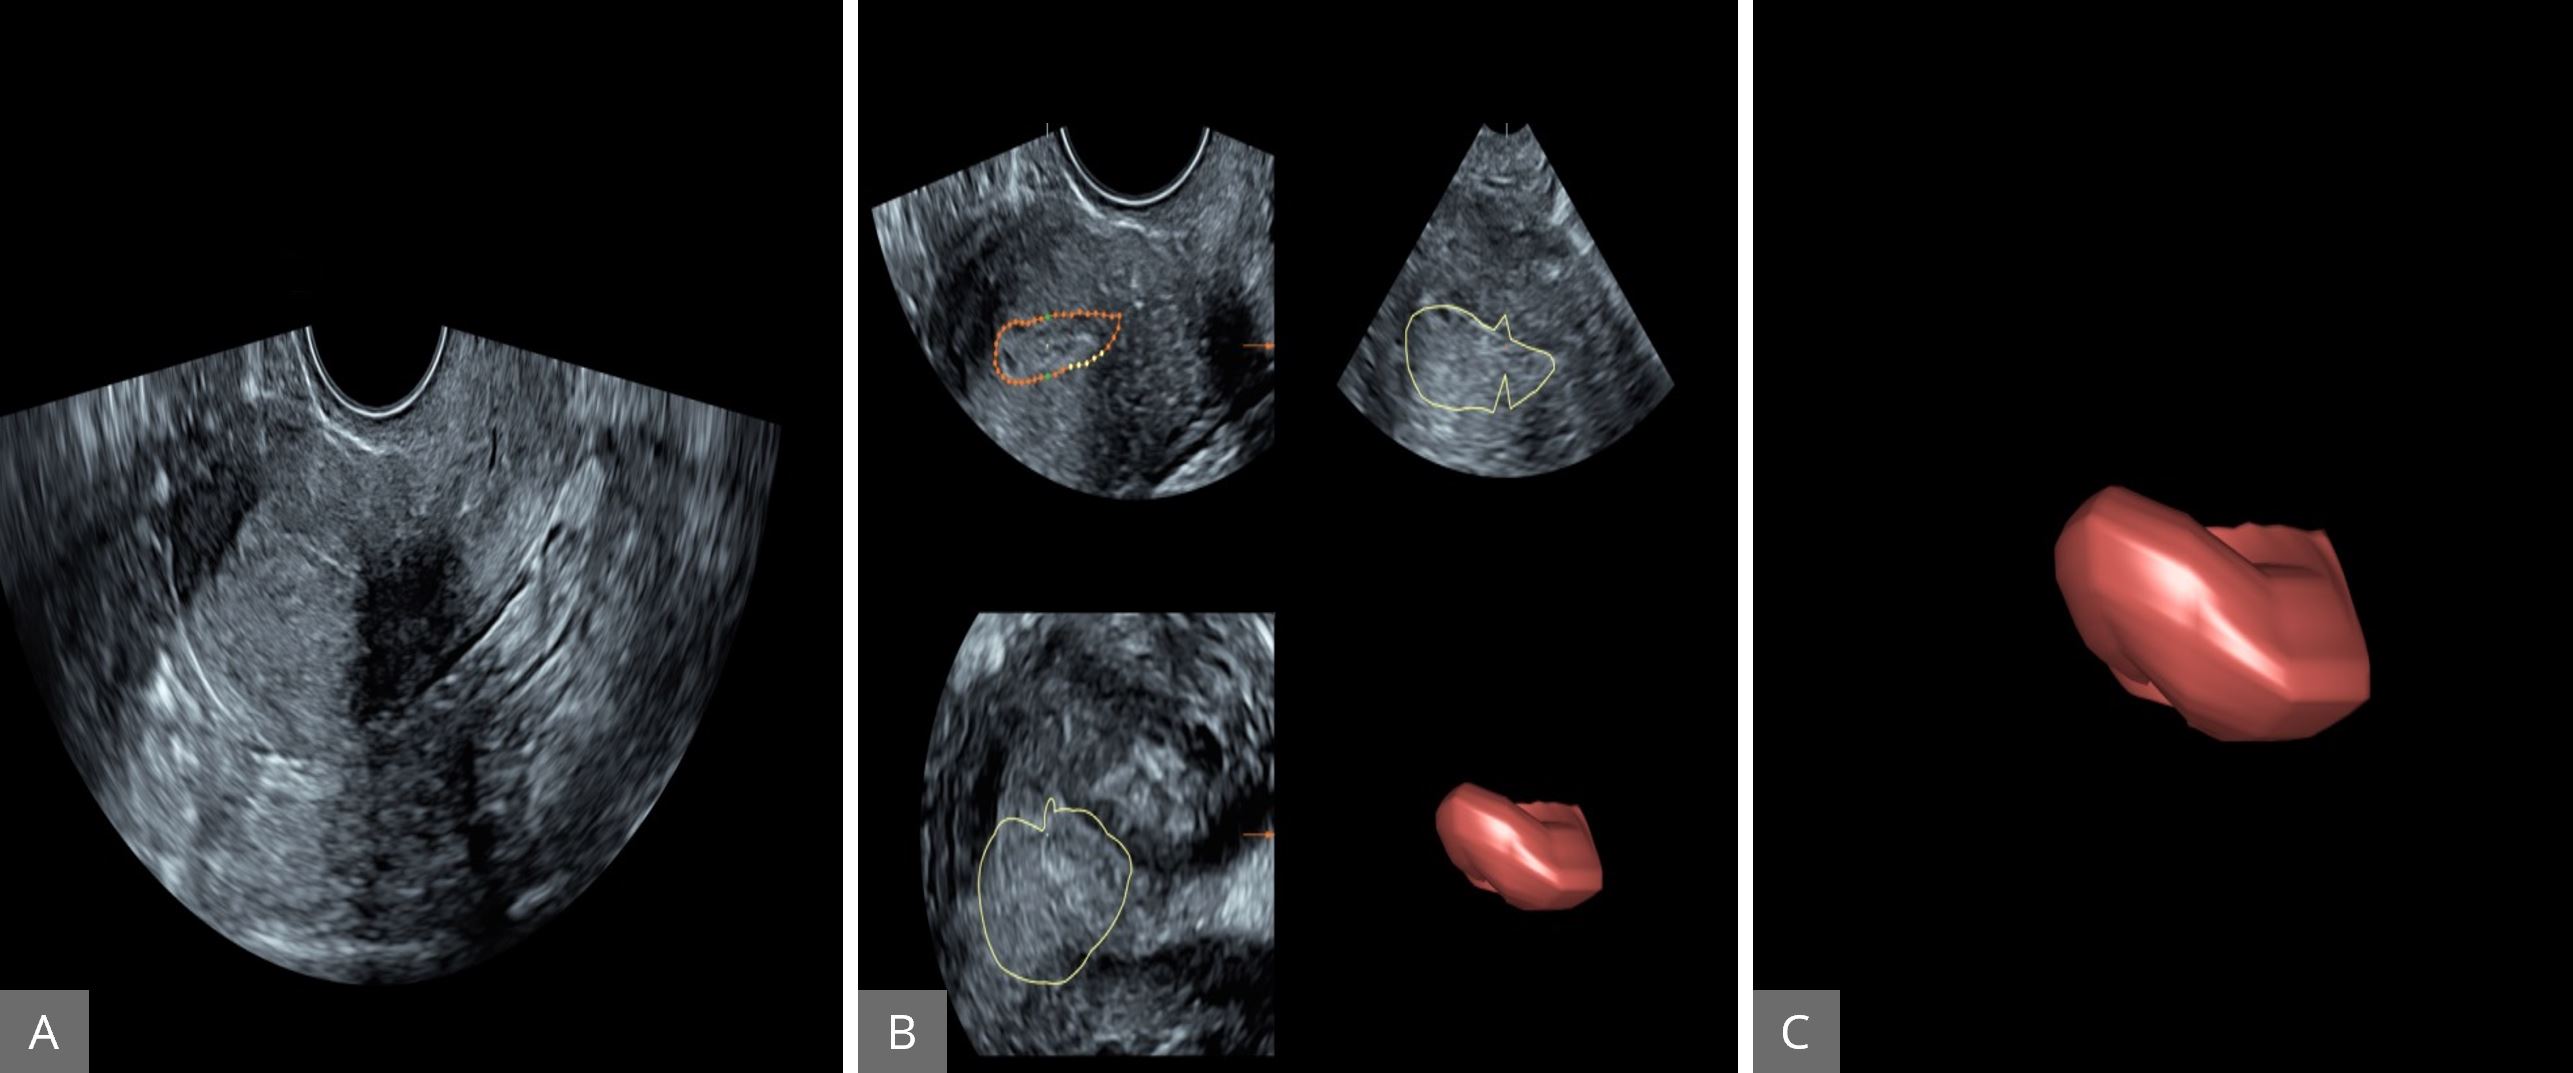
Endometrial hyperplasia is one of the most common gynecological malignancies. The prognosis is usually very good because of early presentation [34,35]. Conventional vaginal ultrasound and pipelle sampling are critical in the evaluation of the patient at the risk of endometrial carcinoma. The prognosis in case of endometrial carcinoma depends on the size of the tumor and the degree of invasion at the time of diagnosis. The degree of invasion is a very important prognostic factor. Transvaginal conventional 2D ultrasound plays an important role in the detection of the degree of invasion of the tumor; however, the sensitivity and specificity are not great [36,37]. MRI is superior to transvaginal conventional 2D ultrasound in this respect; however, MRI is more invasive, expensive, and not readily available [38,39]. The relatively new modality of 3D is a promising tool in objective measurement of the endometrial volume and endometrial vascularity. In this technique, initially using the 2D ultrasound, the endometrial cavity is measured at the maximum thickness in the sagittal plane. The 3D volume bottom was then activated to obtain a 3D volume. Volume acquisition takes 15 seconds while the patient is asked to remain static. After 2D evaluation, the 3D power Doppler gate is activated to assess vascularization. The technique to obtain endometrial volume and endometrial vasculature is explained in Figures 12 and 13 respectively.
We know that the degree of tumor invasion and filtration is related to the size of the tumor and the amount of new vessels formation [40]. Galavan et al. in his publications, examined 99 women diagnosed as having endometrial carcinoma. These women were then assessed by transvaginal 3D power doppler angiography before surgical staging. Endometrial volume, vascular index, flow index, and vascularization flow index were calculated. They concluded that the 3D power Doppler examination of the uterine tumor correlated very well with the tumor invasion [41]. This is a relatively cheap, simple and non-invasive method that can be a very important tool in the management of these cases.

Figure 12. Assessment of endometrial cavity volume by three-dimensional power Doppler angiography. (A) The uterus displayed first using gray-scale ultrasound in sagittal plane. (B) The endometrial cavity outlined using the manual option of VOCAL (30° rotations and repeated for 6 times). (C) The endometrium subsequently created around the outside of the endometrial volume. VOCAL, Virtual Organ Computer-aided AnaLysis.
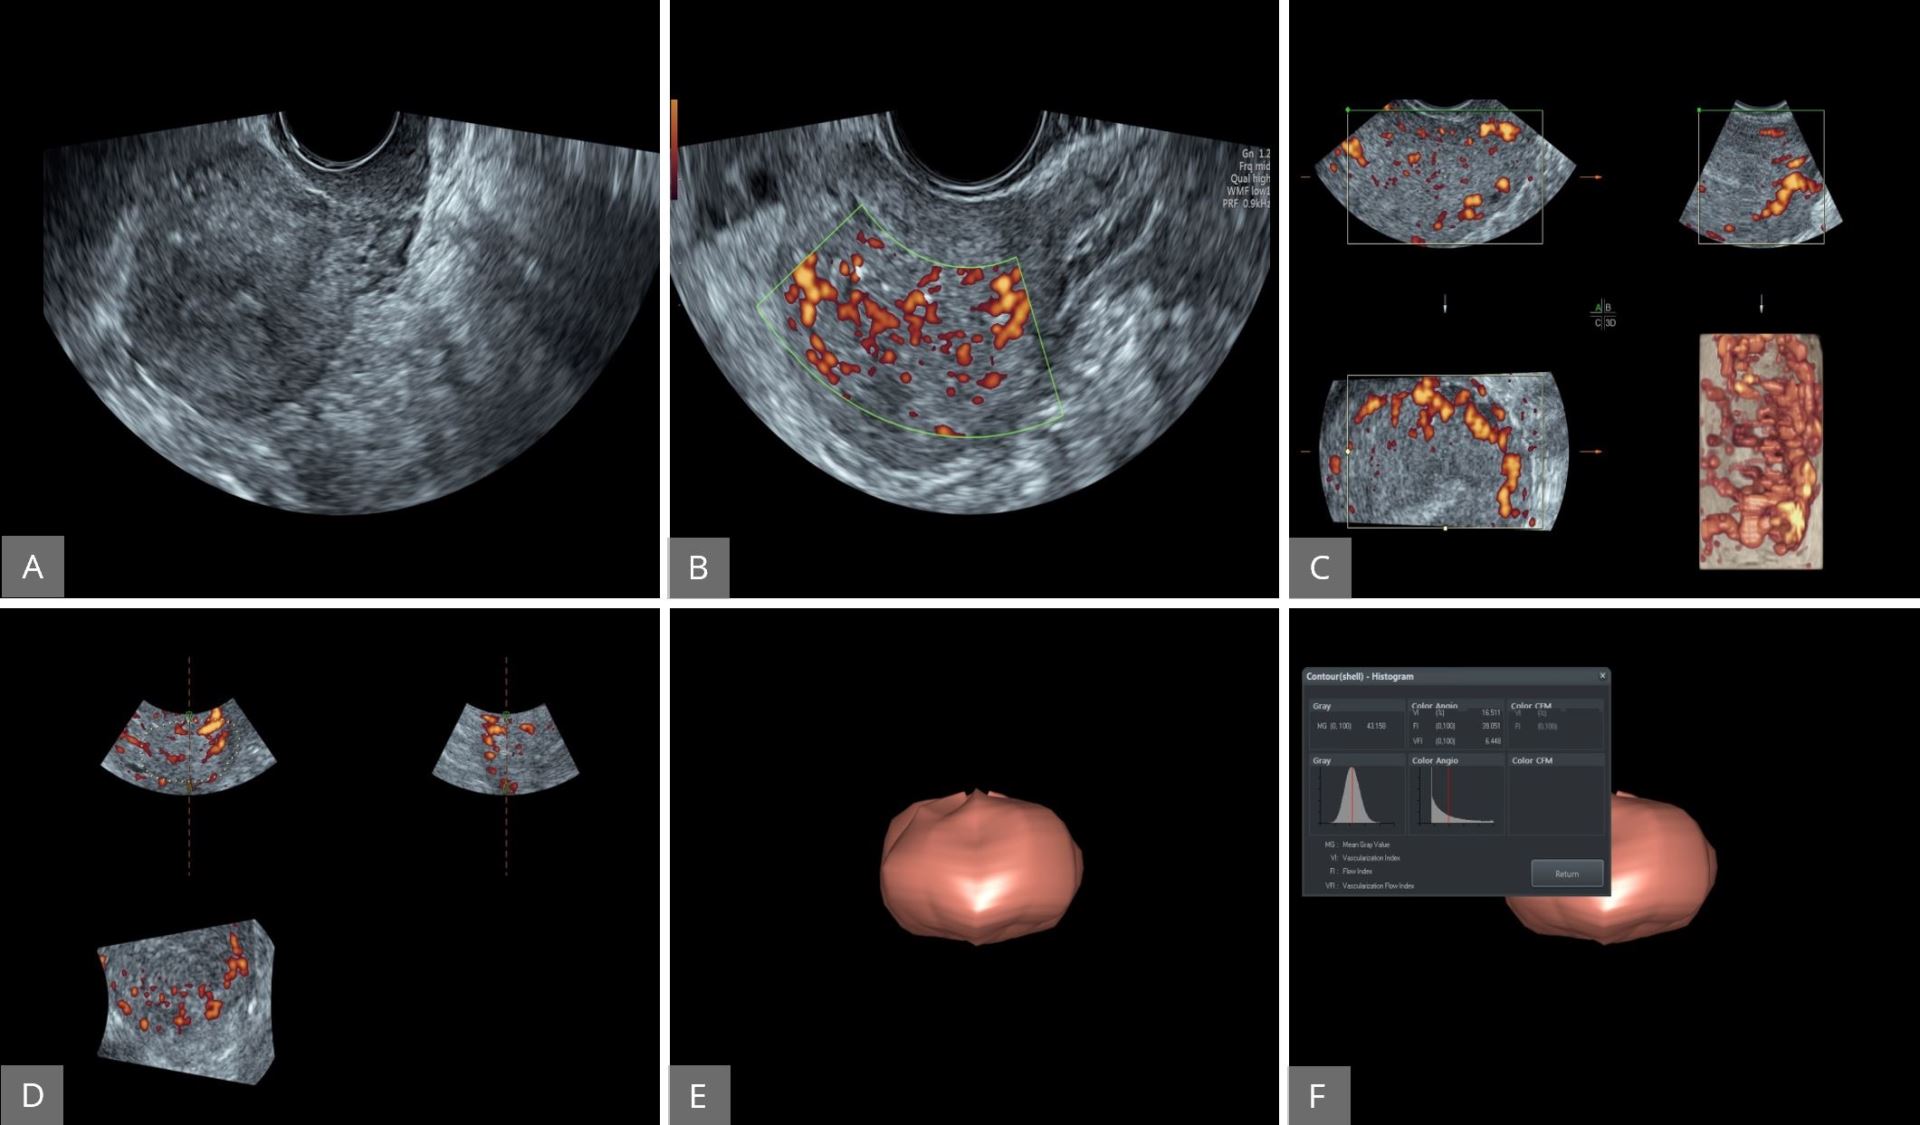
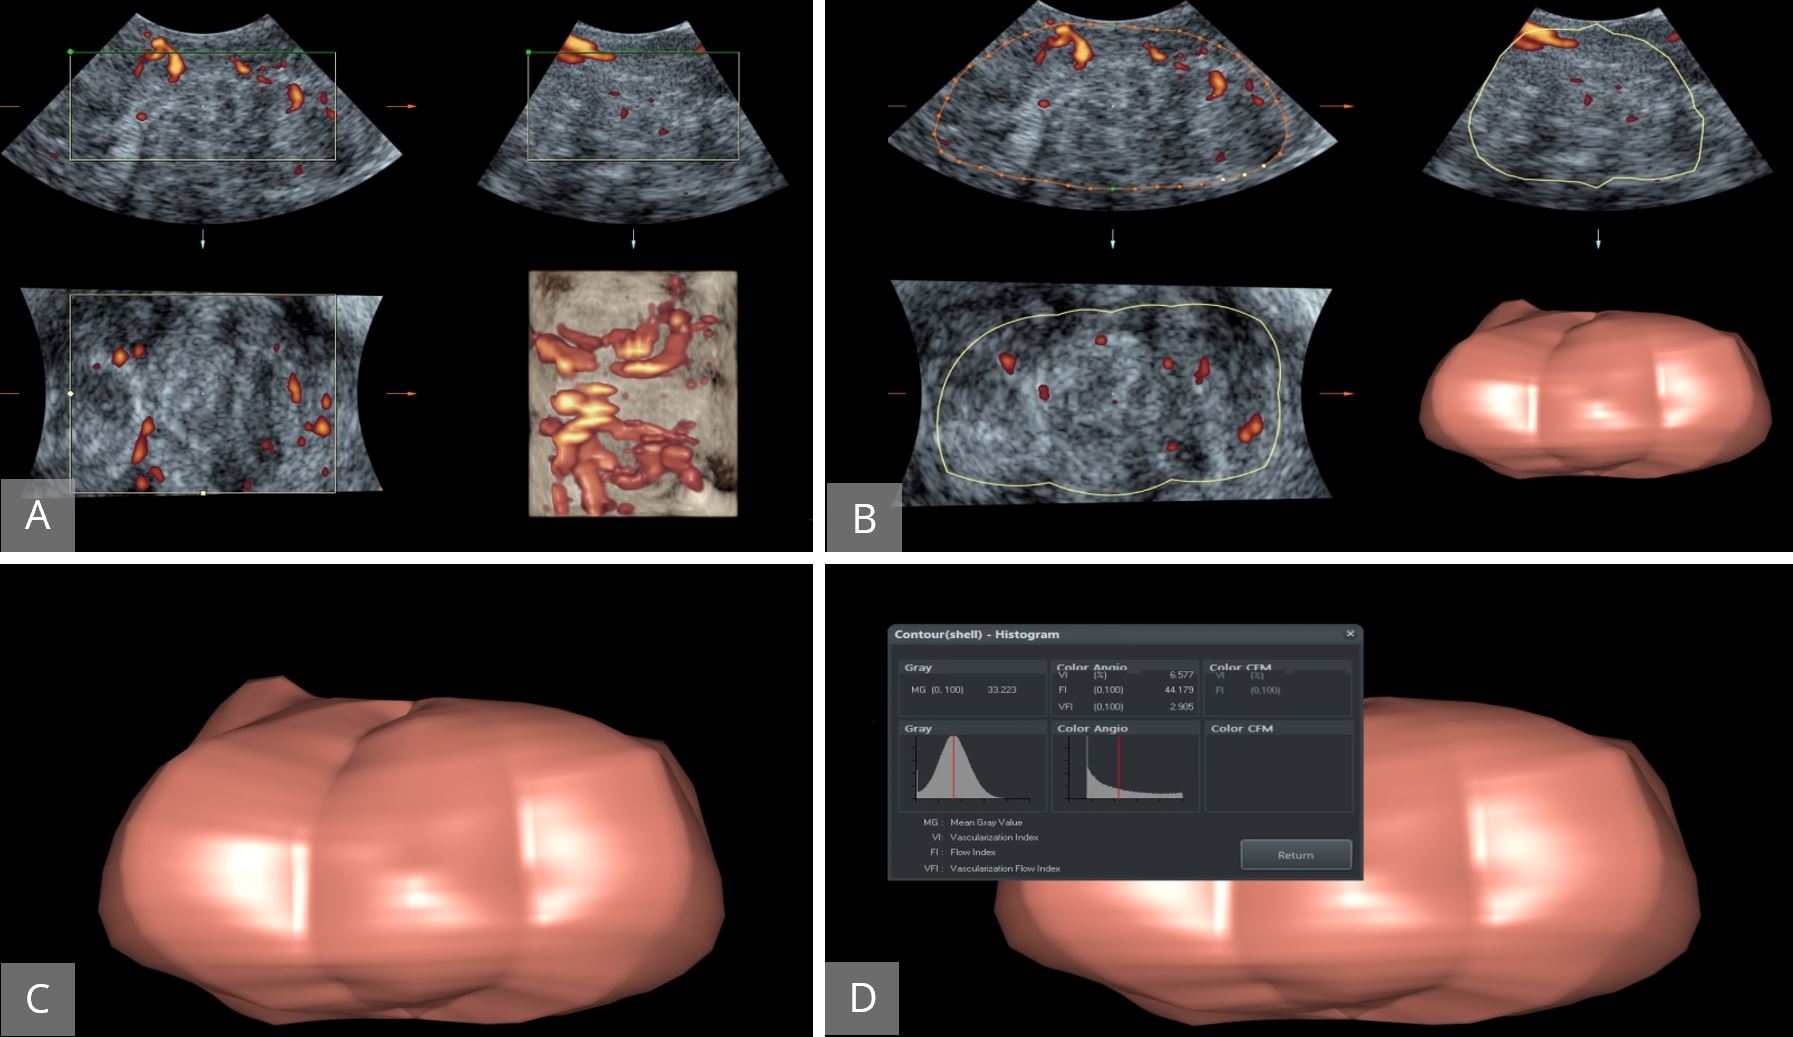
Figure 13. Evaluation of the vascularity of the endometrial cavity using 3D power Doppler. (A) The uterus displayed first using two-dimensional gray-scale ultrasound. (B and C) Power Doppler activated to assess endometrial vascularity. (D and E) The 3D volume activated to obtain the entire endometrial volume. (F) VOCAL software used to calculate the vascularisation index, flow index and vascularization flow index. 3D, three-dimensional; VOCAL, virtual organ computer-aided analysis.
Assessment of Adnexal Masses
Accurate different ion between benign and malignant adnexal masses is critical in the planning of the patient management. We need to remember that the majority of adnexal masses are benign in nature. To optimize diagnostic accuracy, many prediction modules have been employed. These prediction modules include biochemical markers, menopausal status, and ultrasound findings [42-44]. The International Ovarian Tumor Analysis (IOTA) studies produce the statement on how to improve the strategy in the diagnosis of ovarian tumor [43]. In these important documents, the following morphological features were studied in great details, which include the size of both ovaries, the thickness of the thickest septum, the largest projections measured in two perpendicular planes, and the vascular feature. In the vascular feature, the entire tumor was examined by color and power Doppler, where the plasticity index, resistance index, and the peak systolic velocity were recorded.
The risk of ovarian malignancy based on ultrasound findings (risk of malignancy index, RMI) is the most common method used to assess the risk of ovarian neoplasm. Gray scale ultrasound on its own is very effective in classifying the ovarian tumor as benign or malignant in the majority of cases [45,46]. With rapid advancement in ultrasound technique and the introduction of 3D power Doppler, we are now more equipped to differentiate between benign and malignant ovarian tumor. Using transvaginal power Doppler, the vascularity of the tumor reflected by the color content can be seen and evaluated. This can be assessed by visual analogue [47]. We can calculate the vascularization index, flow index, and vascularization flow index (Figure 14). More information on this very rapidly developing field is beyond the scope of this review article.

Figure 14. Evaluation of ovarian vascularity using 3D Power Doppler. (A) The ovary displayed first in gray-scale and 3D power Doppler activated to assess ovarian vasculature. (B and C) The entire ovarian volume was calculated. (D) VOCAL software used to calculate vascularisation index, flow index and vascularization flow index. 3D, three-dimensional; VOCAL, Virtual Organ Computer-aided AnaLysis.
3D volume imaging is the most important advantage in modern sonography after the introduction of the vaginal probe. The great use of 3D ultrasound in obtaining valuable medical details is undoubted and it could replace MRI scans in gynecology patients as it is able to provide the same or even better views. Additionally, ultrasound is less expensive, less stressful to patients, and provides valuable information on organ function in addition to structure. The ability of 3D ultrasound machines to view, retrieve, and reconstruct images is significant in providing useful clinical information. Given these advantages of ultrasound, it is essential for the clinicians to be aware of the great potentials an ultrasound machine and the integrated software can provide beyond the known basic functions. The clinicians should be offered with more specialized training on how to utilize these machines and software. Finally, the use of 3D ultrasound could potentially provide more in gynecology than obstetrics, and again its use should be advertised among clinicians.
Received date: August 30, 2017
Accepted date: March 01, 2018
Published date: March 03, 2019
The study is in accordance with the ethical standards of the 1964 Helsinki declaration and its later amendments or comparable ethical standards.
The study did not receive any specific grant from funding agencies in the public, commercial, or not-for-profit sectors.
The authors report no financial or other conflict of interest relevant to this article, which is the intellectual property of the authors.
© 2019 The Author (s). This is an open-access article distributed under the terms of the Creative Commons Attribution 4.0 International License (CC-BY).


Prenatal invasive tests are being used for the diagnosis of fetal aneuploidies. Fetal loss is the major complication of invasive procedures with varying proportions. In this prospective study, authors aimed to determine the predictivity of cervical length (CL) in terms of miscarriage associated with diagnostic prenatal invasive procedures that are performed in two separate centers.
The use of PRP injection for treatment of plantar fasciitis resulted in significant improvement in pain according to VAS, PRS, and FFI and a reduction in the thickness of the plantar fascia as measured by US, compared to the saline group.
The aim of the study was to characterize children with asymptomatic cervical lymphadenopathy including natural history, radiologic and pathologic findings, and provide guidance in diagnostic and therapeutic intervention and follow-up.
 PDF
PDF